
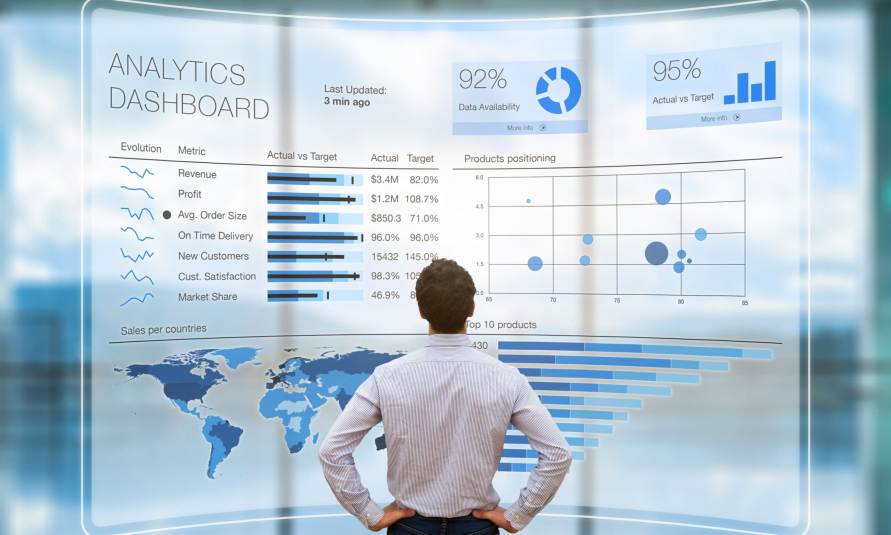
In the first 30 minutes, we discuss:
- The concepts and components of effective dashboards
- How to create interactive dashboards in APM Studio
- How to design your dashboards to create visually appealing insights
The webinar session is followed by a 20-minute Q&A session.
Dashboards from asset data in real-time
Just collecting data is not enough. To fully utilise it, the data should be displayed comprehensively and intuitively. This is where dashboards come in. Thoughtfully set up dashboards provide so much needed context that allows companies to analyse asset data and make connections that were previously impossible to detect. However, creating valuable customised dashboards can be difficult.
In this webinar, we will show you how to create meaningful dashboards that visualise asset information and key performance indicators (or KPIs) in minutes. You will learn the main Asset Performance Management related tips and tricks in quickly optimising your dashboard.
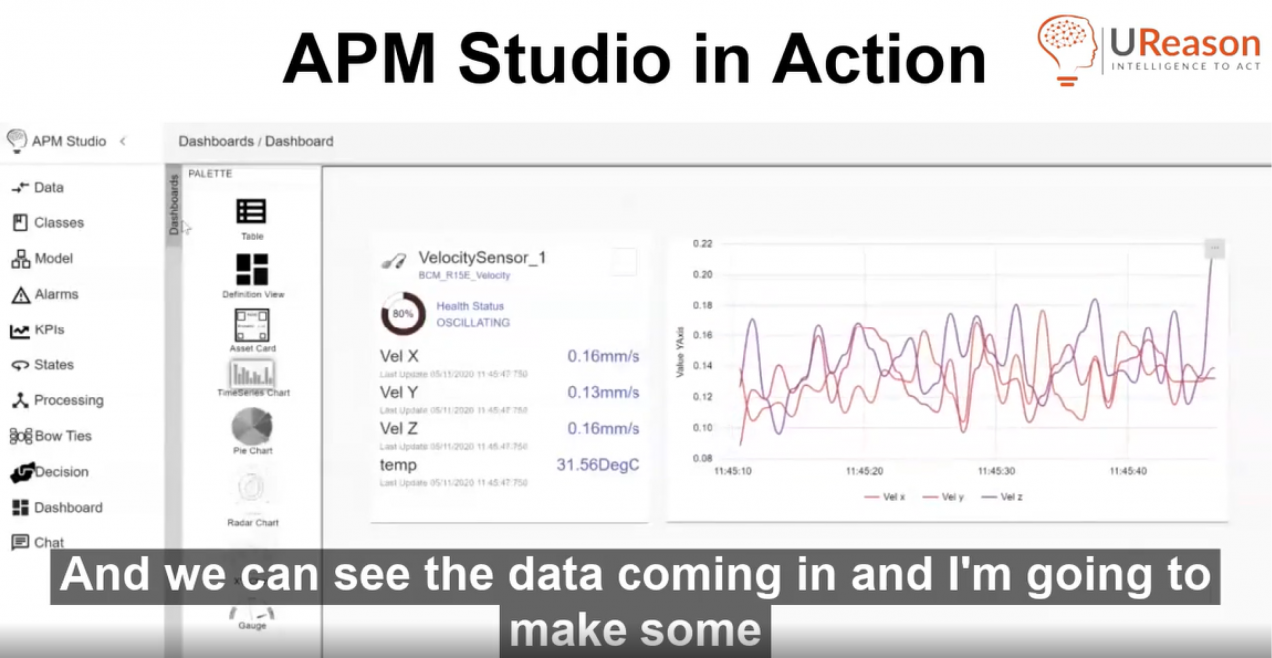 Your browser does not support the video tag. APM Studio in action
Speaker
Jules Oudmans – Director Consultancy
Jules Oudmans is one of the co-founders of UReason, a provider of technology products and services enabling companies to quickly create intelligent applications that automate complex reasoning on large quantities of real-time data and events. Jules is a seasoned professional active in the field of operational intelligence and real-time analytics.