“Fewer failures, no unplanned downtime, better scheduling of operations and maintenance. ‘Smart’ or ‘intelligent’ machines can help achieve these goals. It is then not merely about collecting data generated by machines
and processes. ‘Intelligent systems’ emerge the moment a machine or (computer) process can make a trade-off about what the best next action is. That progression continues the moment there is enough available data to train machine learning algorithms to predict something. For example, consider knowledge about how the quality of oil in a particular engine or transformer will evolve based on historical data so that appropriate maintenance can be performed in a timely manner.”
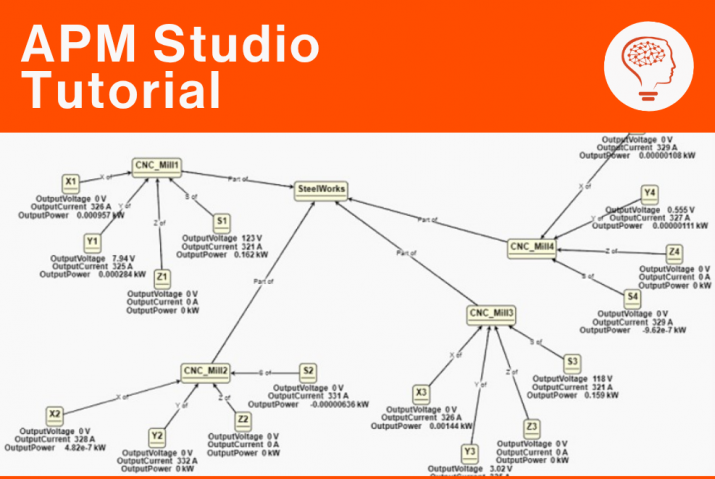
Speaking is Jules Oudmans of UReason, a software company that helps manufacturing companies optimize the asset performance management system based on machine learning and knowledge models.
Machine learning
“Machine learning can help predict when maintenance is needed.” Back to basics for a moment. Machine learning, a form of artificial intelligence (AI), is a technique that builds algorithms based on data that can make useful judgments about that data. For example, it can extract certain anomalous values from the data or indicate that an event is about to happen.
Better scheduling of maintenance
Oudmans: “In industry, supervised learning is regularly applied with the goal of early fault detection to prevent unanticipated failures. For example: when a pump fails, production can stop. This can be prevented by training models – such a s neural networks – based on data from the past so that deviations that will lead to failure can be detected at an early stage. Consider the formation of shale on the pump, the company can do two things with this information: it can schedule maintenance earlier to prevent failure or it can adjust a number of parameters in the production process so that the moment of expected failure can be pushed forward.”
Define your goal and map it in detail
Everything thus starts with data. “That’s a little more nuanced. You have to have enough reliable historical data but, more importantly, you have to have a goal of what you want to do with that data. That’s where the shoe regularly wriggles in practice. Companies collect data, but what’s next? Suppose you want to address unplanned failure of missioncritical machines. It is then important to first identify a selection of failure modes. The next step is to find out what caused these failure modes in the past and what effects they caused. Then it is necessary to see in what data these deviations can be con- stated. Based on the data and the functional degradations and failures, models can be created that are trained to recognize failure – even before the failure occurs.”
From theory to practice
Oudmans explains the theory again using the before picture of the pump. “A company wants to prevent a particular pump of a mission-critical machine from shutting down. The pump can have several failure modes, such as poor shaft alignment, insufficient pressure or insufficient suction. Some of the underlying causes are cavitation, impeller wear, a clogged suction line, valves that do not open fully, and so on. Measurable effects, depending on the cause are noise increase, increased vibration, a leaking seal, bearing wear, decrease in pump efficiency or impeller erosion. The failure modes, causes and effects can often be derived from various data sources such as the OEE database (Overall Equipment Effectiveness), the data generated by vibration sensors, the CMMS system (Computerized Maintenance Management System) and other historical process data. By making (statistical) connections between different data collections, it becomes clear how data can lead to useful information. If this is clear, then a model with algorithm can be established that teaches the system to recognize anomalies at an early stage.”
But how do you start?
Making connections between different data sets is not easy. Therefore, over the years a number of stan- dard methods havebeen established that can help with this. One of them is the CRISP DM model, which stands for CRoss-Industry Standard Process for Data Mining. This method is often used to search very specifically for (statistical) relationships between different data sets. Basically, six steps are important: business understanding, data understanding, data preparation, modeling, evaluation and deployment. (see coworker: Six steps from raw
data to insights).
Oudmans: “In practice, this method boils down to making known what the problem you want to solve is, based on the data and knowledge often available in the company. After selecting and preparing data, a model is formed and trained. This training is done with data from the past. A company has collected historical failure data from a pump in the past. From the data, the functional degradations can be deduced. The model created is then fed with this known data set and trained to recognize the different failure modes. We then give the same algo- rythm another historical data set that he has not seen before so that we can verify that the model can predict with good accuracy the failure modes we are interested in.”
A positive result is very important here. “The model should have minimum accuracy of eighty percent. If the percentage is eighty percent or lower, it means that two out of ten times (or more often) the model thinks it is
detecting an error but is wrong. So in two out of ten cases, it is a false positive. If this is the case, it is advisable not to make the move to predictive maintenance for the time being, until there is sufficient accuracy.” If the results are positive, then rollout can begin and connections are made to real-time data sources. This is followed by evaluation and fine-tuning.
Knowledge
Setting a concrete goal and reliable data are important. Knowledge is a third aspect important to success. “Companies that assume they don’t need knowledge themselves because machine learning models are ‘self-learning’ systems are going to come out cold . Knowledge does matter a lot. If you have high knowledge and a lot of highquality data, then you can make good decisions based on the results the trained one displays. If your knowledge and
expertise is not as good, but you have a lot of high-quality data, then you can still make good decisions, but the quality of the decisions is not as good. The same goes for a lot of knowledge
and low quality d a t a .” Little knowledge and little reliable data equals a trajectory doomed to failure. “In practice, we see many companies that either have too little data or too little reliable data. This may be because-when it comes to failure data or functional degradation-there is not yet a tight discipline to store this while it can be very valuable. Therefore, it is recommended to accurately collect and document degradation data. That way, the step from preventive to predictive maintenance will be faster.”
From raw data to insights in 6 steps
Important in this regard is that a clean dataset is selected whereThe CRoss-Industry Standard Process for Data Mining model is often used to gain insights from data. Roughly speaking, this model consists of six steps.
1) Understand your business
The first stage focuses on the precise description of the problem or project objectives from a business and economic perspective. A project plan for the project must be developed based on the concrete business and analytical objectives. The project plan includes the required time, personnel and material resources.
2) Understand your data
After formulating the analytical objectives, the next step is to select the relevant datasets. This stage helps identify existing correlations from the datasets. It also reveals whether there are possible quality defects
in the data. The phase consists of the following four steps: collecting(1), describing(2), analyzing(3) and evaluating(4) the data.
The first thing to consider is whether the data can be collected reliably. What sources are available? To what extent do the data from these sources contribute to achieving the stated goals? Is the data usable or should it be generated in some other way? Problems that arise during the collection process should be documented or resolved to avoid possible deviations in the future. The data collected by data source should then be properly documented: dates, time, format, quantity,…Finally, it should be determined whether the data sets are
sufficient and usable for analysis.
3) Preparation dates
This phase includes all activities to create the final dataset or dataselection that is loaded into the modeling software for analysis. Data quality and technical conditions play a major role in this process. At the end of this process, it should be clear which data sets will be included or excluded in the analysis. The importance here is that a clean dataset is selected where the same measurement unit and data types occur per data column so that everything is correct.
4) Modeling
This is often a very challenging step. A modeling technique must be selected with which to create the model. One often wants to be able to observe a certain trend or certain anomalous properties of normal behaviour within certain datasets that indicate a specific failure mode. To check the suitability of the model, a test model – also used for training – will be used to check its quality and accuracy. It is important that error rates are low. After training and checking the test model, a model validation and evaluation will follow.
5) Evaluation
The results resulting from the test model are compared with the predetermined objectives. Companies will have to decide at this stage whether the model is suitable enough to be further refined if necessary and then implemented in business processes.
6) Rollout
The deployment phase is the phase that no longer takes place offline, but online/in real time. The knowledge gained and models constructed will be put into practice. Drafting an implementation strategy, monitoring the results of the models, updating and fine-tuning are part of the rollout. Practice shows that much time – often more than half the time – is required for data preparation. Only 20 to 30 percent of the estimated time is spent determining the re- levant datasets. The rest of the time is spent defining the business issue, measuring performance and implementing the models created.