Today’s Case
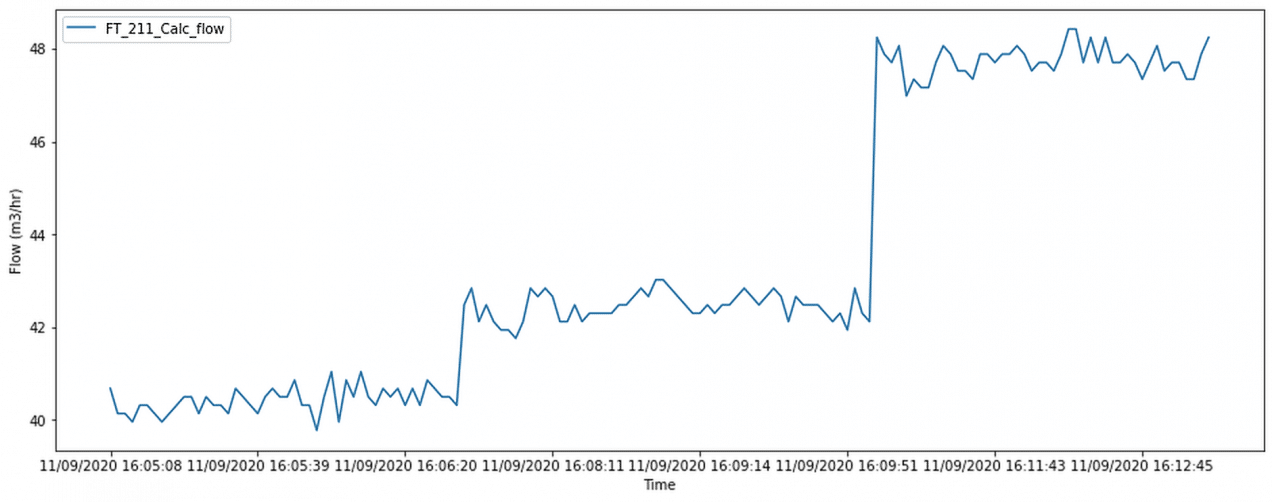
This case study looks at data from a magnetic flow sensor in a pump system. The system is experiencing fouling in the downstream section, which is depicted in the data as a flow increase in the upstream section to compensate and keep the flow steady in the overall system, see Figure 1. For asset owners it is important to know if the system is experiencing fouling, since it could lead to severe damage to the pump or other assets.
To detect fouling events, there are many different machine learning and statistical algorithms one can choose. This article highlights that a simple statistical process can be utilized instead of a complex machine learning algorithm by exploring the Auto Regressive Moving Average process, in short (ARMA).
ARMA
ARMA is a combination of two basic statistical processes, the AR and MA process. AR stands for Auto Regressive. MA stands for Moving Average. The ARMA should be applied to a weakly stochastic stationary timeseries Xt. A timeseries is called weakly stochastic if the mean and standard deviation are constant in time. Both the AR and MA process can have different orders. This is denoted by the variables p and q, resulting in ARMA(p,q). A mathematical representation of the process would look like this:

The formula shows that the datapoint at time t is depending on past values and past errors. This means with an ARMA process, there is a capability to predict values, and this is being exploited in this article.
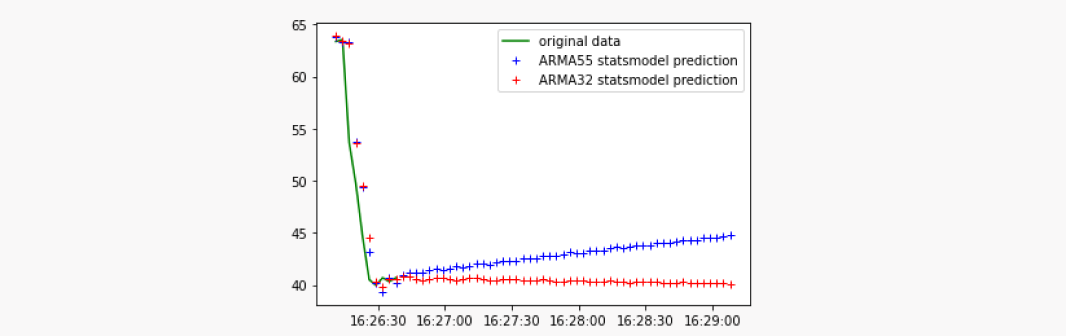
There can be different orders of the process. As aforementioned, there are parameters for the AR and MA process. A common mistake can be to choose parameters that are too high and then have overfitting. Overfitting means if your process is reacting too much to the noise of the dataset and therefore giving you a skewed result. An example of this can be seen in in Fig. 2.
Result
Being aware of overfitting, the ARMA(2,1) process is used and applied to the data from Fig. 1. Since the data is coming in in timesteps, prediction is calculated on previous data and updated as soon the new data is in. As an upper and lower bound, a rolling standard deviation of the last few predicted data points with ARMA can be defined and multiplied by 3. This is done to include only data that is statistically close to the mean value.
If a new value is now higher than the threshold, it can be seen as an outlier and an alarm can be raised
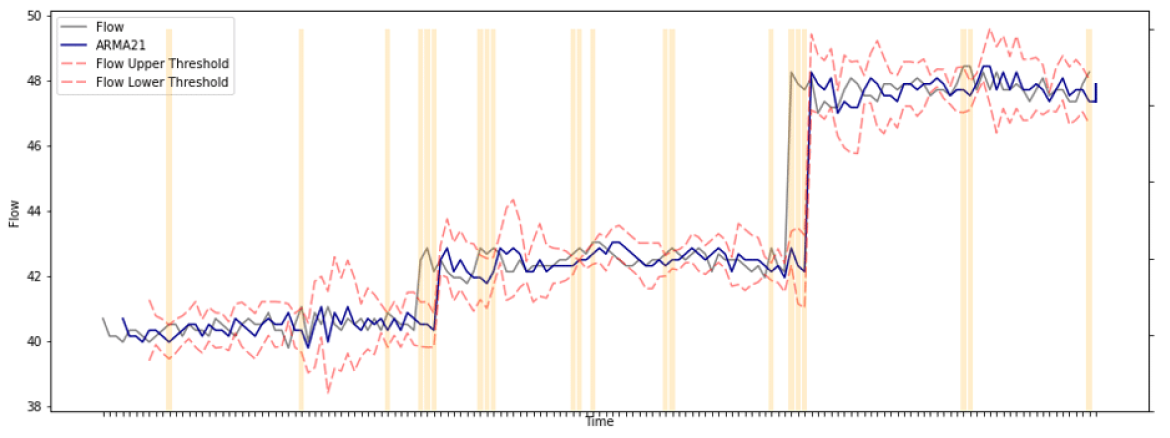
The predictions made by the ARMA model are clearly limited. Thus the interpretation of the model results should be made with caution. ARMA can be used to predict some steps ahead and therefore detect outliers in the near future. In a situation where outliers occur more periodically, there might be a system fault that could lead to a failure and a shutdown of the system. This can be costly and is better planned for in advance.
Algorithms Out of the Box
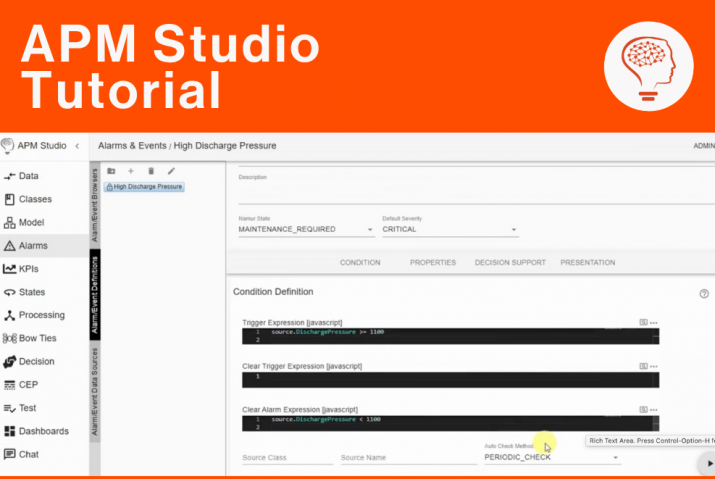
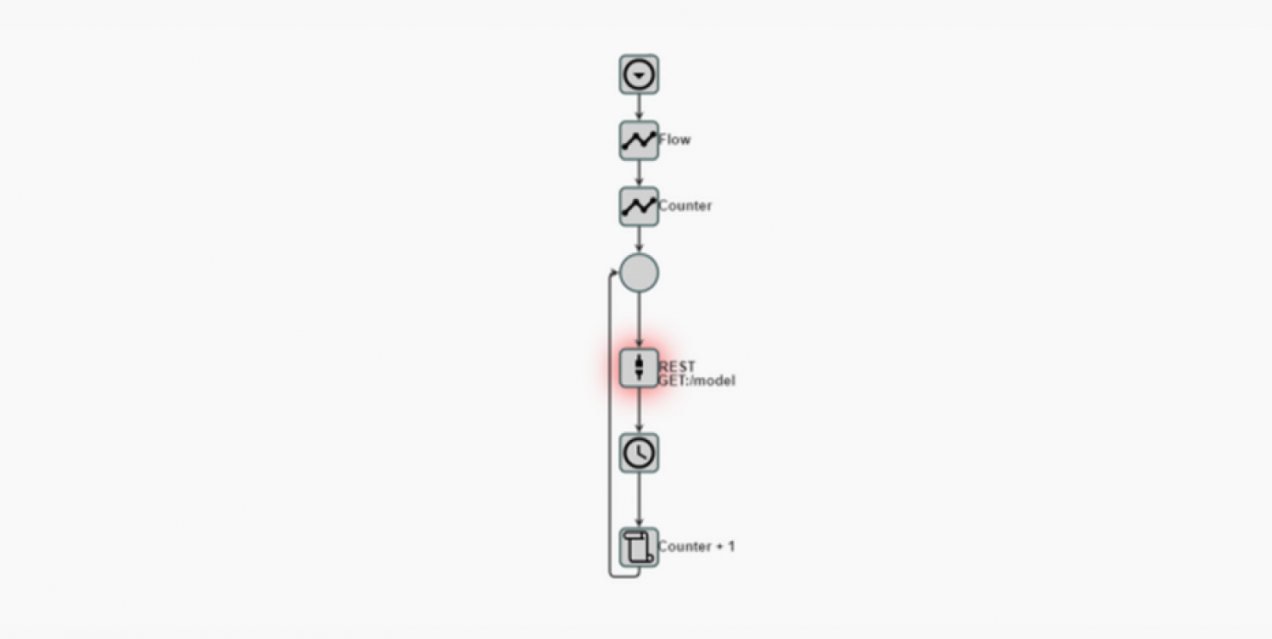
UReason’s in-house software APM Studio combines specific statistical and machine learning algorithms and can set alarms which detect these kinds of outliers, even with a simple ARMA process. By setting alarms on these kind of features APM Studio can prevent unplanned downtime and save time and money for your organization. In Fig. 3 a demonstration of the algorithm is shown. In Fig. 4 the implementation of the algorithm in APM is demonstrated by a REST server call. A screenshot of how the alarms look in APM is shown in Fig. 5. Figure 4 Implementation of the ARMA REST call in APM Studio.
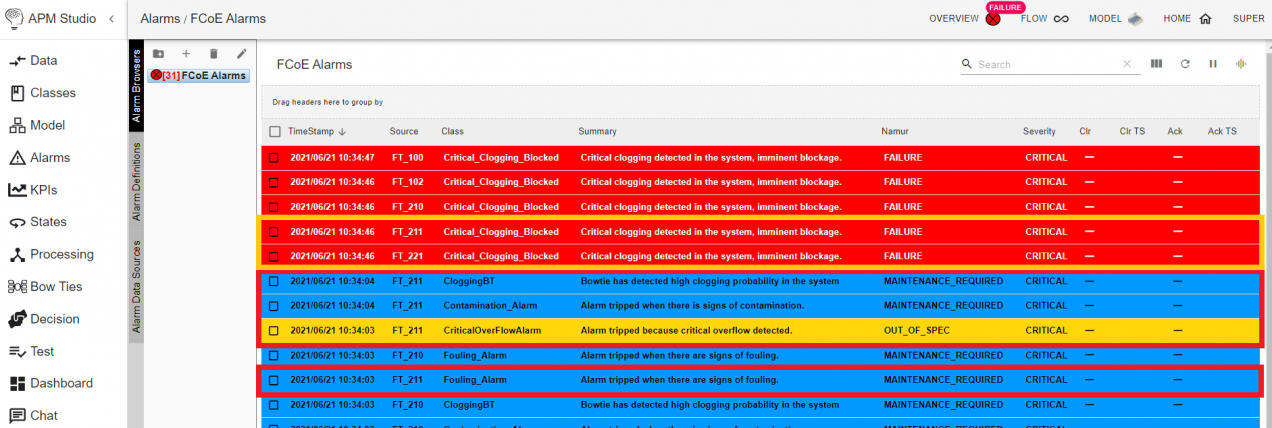
There are 5 alarms raised associated with the sensor ft_211. First one from below to top is a fouling alarm, the second one is an overflow alarm followed by a contamination and clogging alarm. The last alarm is a critical clogging alarm indicating a failure of the system.
Get a Free Demo
Data is only valuable if it can help make data-driven decisions. Request a free demo and experience the power of combining data and industry expertise.