Introduction: Why Bowties Matter?
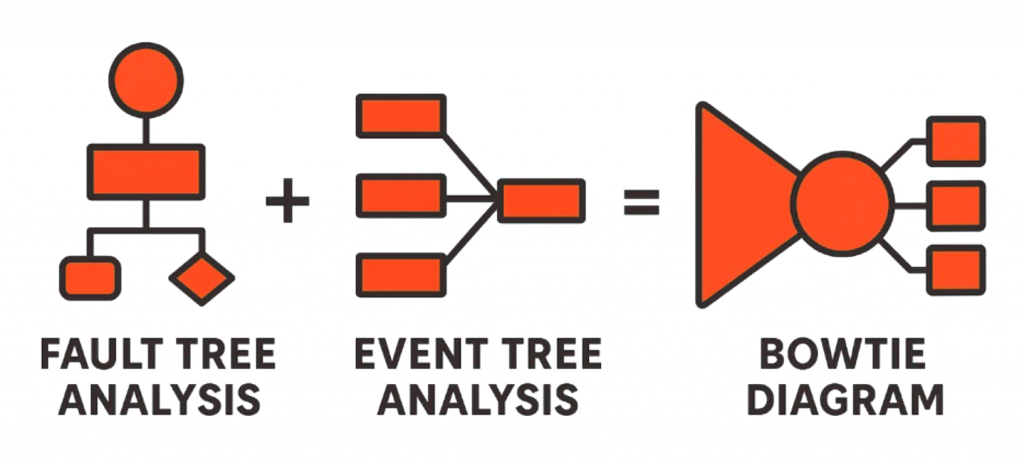
In reliability and safety engineering, Bowtie diagrams occupy a unique space. They combine the logic of Fault Tree Analysis (FTA), which explains how failures occur, with the structure of Event Tree Analysis (ETA), which maps what happens afterward. The result is a single, intuitive visualisation that captures both cause and consequence pathways.
A Bowtie diagram is a risk management tool designed to:
- Identify and visualise risks – showing threats (left side), the critical event (knot), and potential consequences (right side).
- Highlight barriers and safeguards – both preventive (to stop the event) and mitigative (to limit its impact).
- Support better decisions – making complex risks understandable for both engineers and managers.
The outcome: safer processes, fewer design flaws, reduced downtime, and ultimately lower financial and operational risk. In short, a Bowtie diagram shows both how a failure can happen and how its consequences can be mitigated.
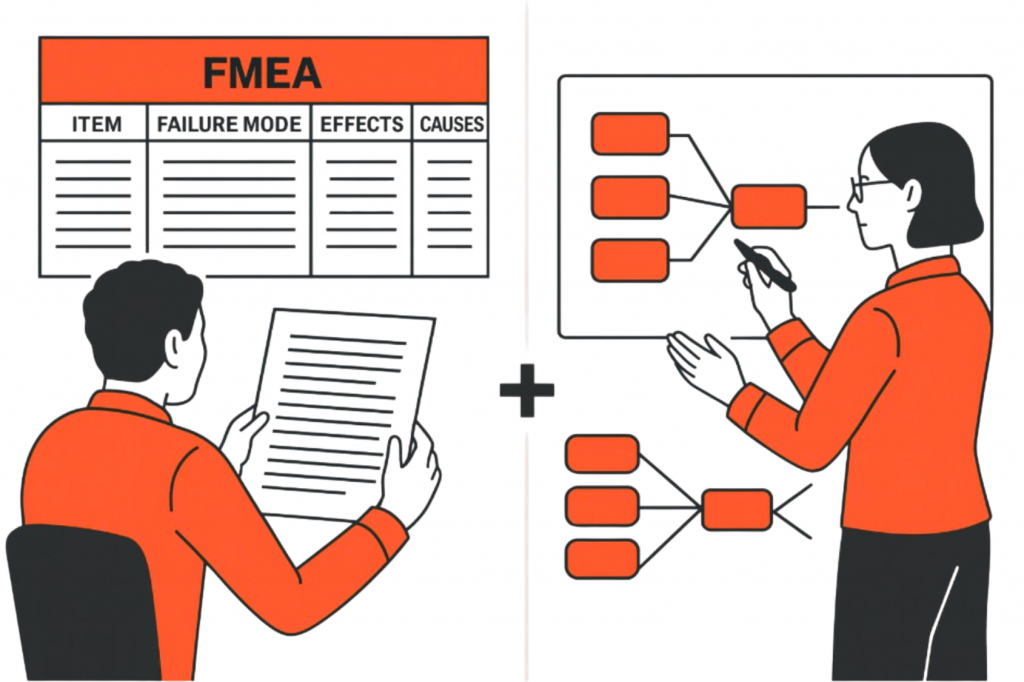
While Bowties are powerful tools, creating them is quite tedious. Traditionally, engineers have relied on FMEA and FMECA documentation as their source of data. These contain tabular and textual content that captures possible failure modes, their causes and consequences. Turning those into Bowties, however, requires time and expert engineers. A paper by Fritzsche and Oks found that maintenance workforce spend up to 35% of their time in information gathering*. For all their value, creation of these Bowties remains largely manual, with limited options for automation.
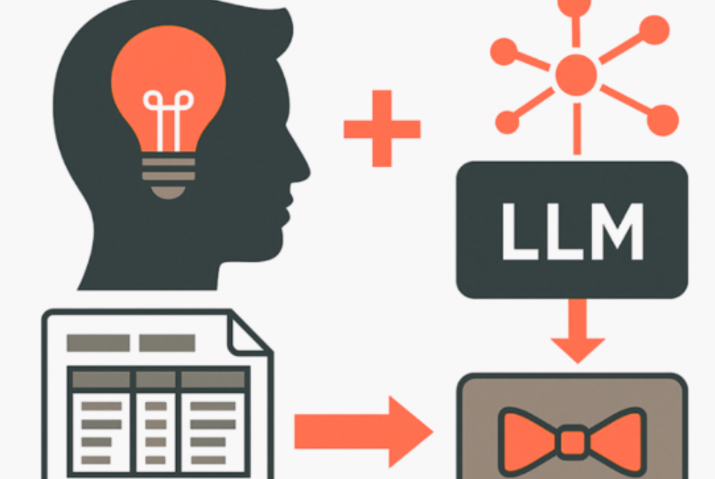
Enter Large Language Models. These are advanced AI systems trained on massive amounts of text, everything from manuals to articles and much more. This allows them to “read” documents and make sense of them. With the right instructions (what we call prompts), they can turn dense, technical content into structured outputs. For Bowtie diagrams, that means automating a process that was once slow, manual, and expert-only.
*Source: Information Systems I – Innovation & Value Creation by Dr. Sascha Oks and Dr. Albrecht Fritzsche.
The Bottleneck of Manual Bowtie Creation

Bowtie diagrams can be created in different ways. Sometimes a single safety engineer builds them directly from FMEA tables or reports, mapping out causes, barriers, and consequences. In larger projects, Bowties are often developed in team workshops, such as a HAZOP study, where engineers, operators, and domain experts collaborate to capture risks and safeguards. Individual work is quicker but limited by perspective, while team-based creation is richer in insights but slower and resource-heavy. In both cases, the aim is identical: to provide a clear, structured visualisation of how failures occur and how they can be controlled.

However, creating Bowties with these methods be it individuals or in group settings can be a productivity killer:
- Each diagram takes considerable time to build, especially when drawn from large FMEA documents.
- Different engineers may interpret the same table differently, leading to inconsistencies.
- When dozens or hundreds of Bowties are needed across assets, manual methods quickly hit a limit.
- Many Bowties are built in workshops (e.g., HAZOPs), requiring senior specialists, a costly and resource-heavy process.
For industries like aerospace, energy, or manufacturing, where hundreds of FMEA documents may exist across different phases (product, design, software, manufacturing), the manual process simply doesn’t scale. Experts have other responsibilities beyond just creating such diagrams which only account for a small portion of their workload.
Automating the Process with LLMs
So how does the leap from dense FMEA tables to clean Bowtie diagrams happen? This is where Large Language Models step in. Instead of manually reading every row, engineers can now hand the heavy lifting to AI.
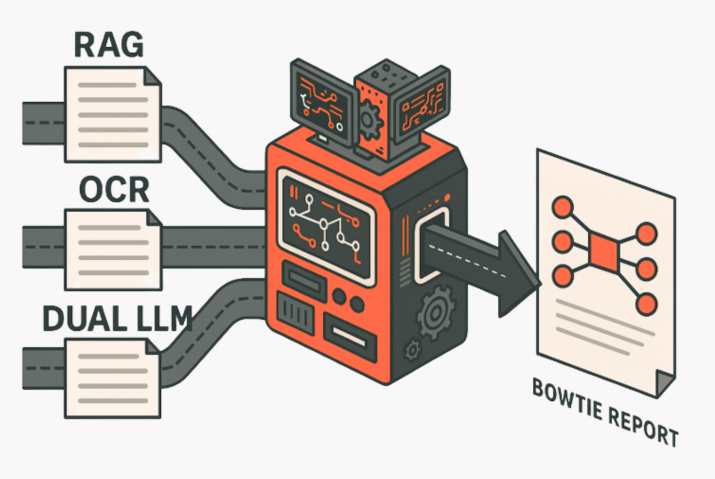
Our designed pipeline works like so:
- Input the Data – Whether it’s a structured FMEA table, a scanned PDF, or even a quick screenshot, the content goes into the pipeline.
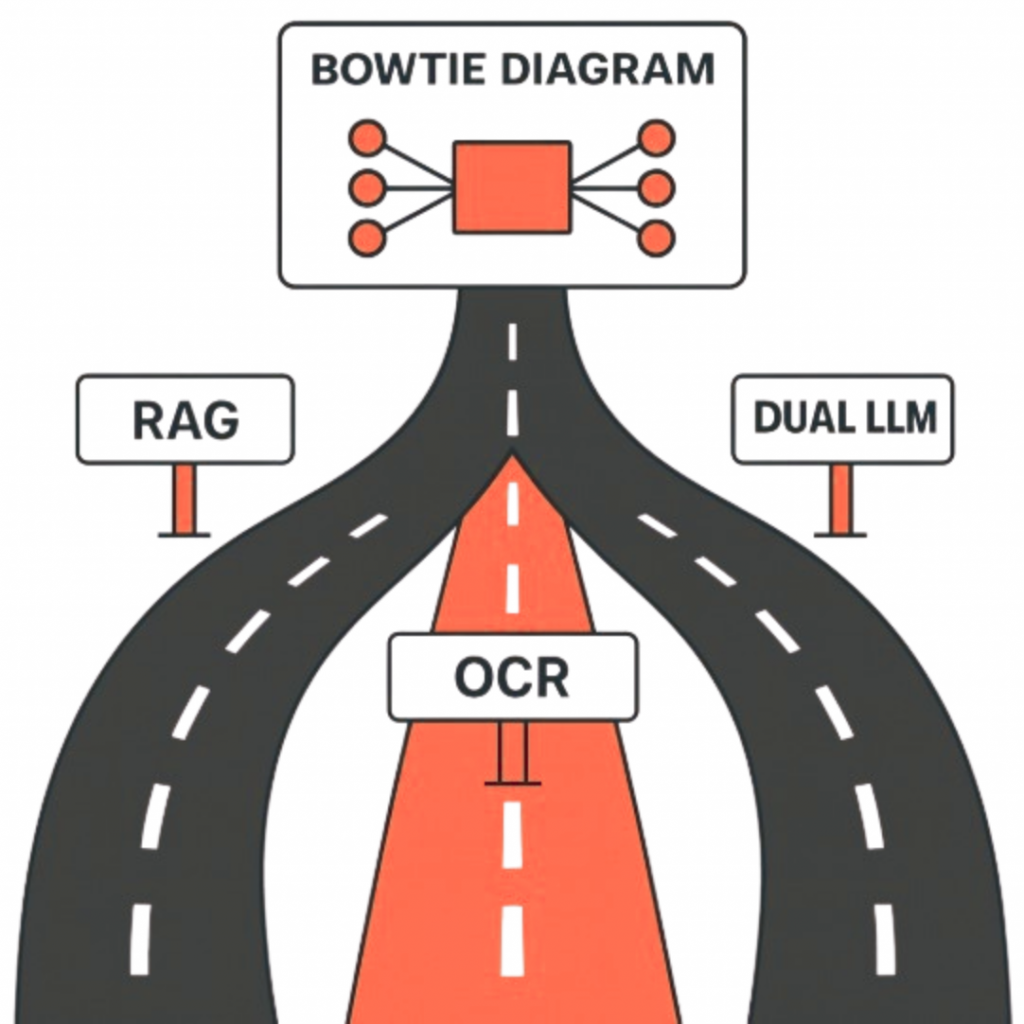
- LLM Processing – Depending on the format, different pipelines can be chosen:
RAG (Retrieval-Augmented Generation): Perfect for text-heavy, well-structured documents. It chunks and indexes the content, then lets the LLM retrieve exactly what’s needed based on user prompting.
OCR (Optical Character Recognition) Pipeline: Useful when the source is an image of a FMEA table. The text is extracted first, then parsed by the LLM based on prompting.
Dual LLM Pipeline: Combines vision and text models where the OCR extraction of tables & text is handled by a larger vision enabled model. - Output: A structured Bowtie diagram in JSON format, ready to render visually.
In other words, what used to take an engineer hours now take minutes.
Why This Matters for Industry
Automating Bowtie creation isn’t just about saving engineers a few hours, it unlocks entirely new capabilities:
- Faster risk assessments: Hundreds of FMEAs processed in hours instead of weeks.
- Standardisation: Every Bowtie follows the same schema, reducing inconsistencies.
- Scalability: Centralised Bowtie libraries spanning various assets and processes can be stored and retrieved on an as needed basis.
- Integration: Bowties can feed into broader system models (CLDs, monitoring dashboards, Bowtie chaining)
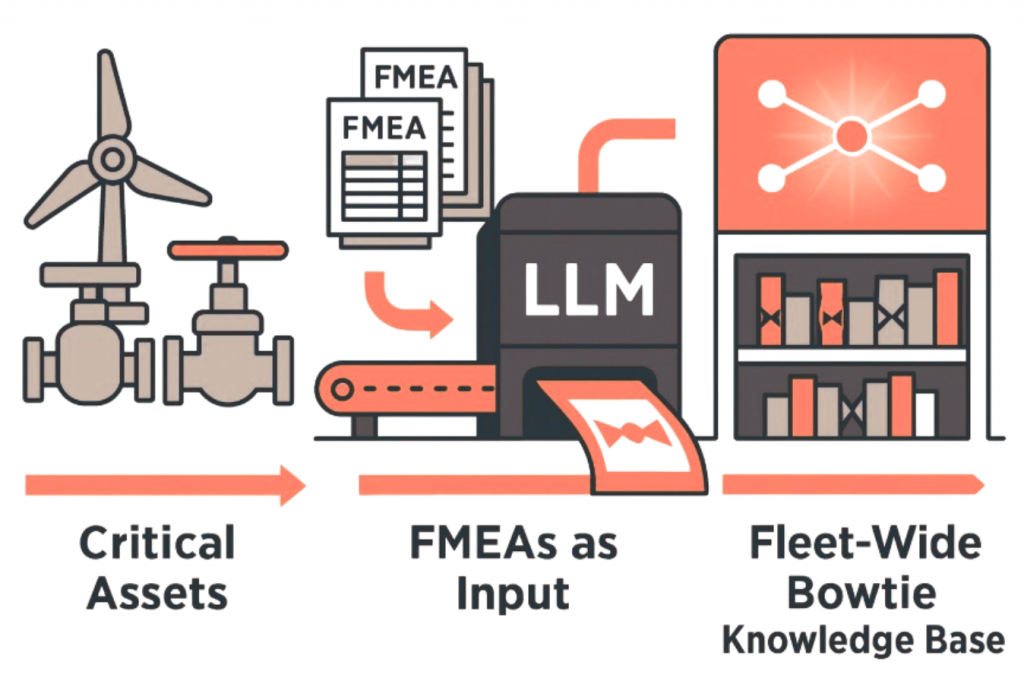
Picture an energy company conducting risk assessments across turbines, pumps, and valves. Today, engineers might spend weeks manually creating and piecing together diagrams, each stored in separate reports. With automation, those same FMEAs could feed into a centralised Bowtie library, a searchable knowledge base that spans the entire fleet of assets. Instead of siloed insights, the organisation gains a single source of truth, making risks easier to track, compare, and act on.
Bowtie diagrams will always require expert judgment, but LLMs can remove the grunt work of building them. By automating the mapping from FMEA to Bowtie, risk analysis becomes faster, more consistent, and scalable. The bottom line: AI doesn’t replace human expertise, it augments it, giving engineers sharper tools so they can focus on insights instead of paperwork.
Next in the Series: Three Pipelines, One Goal – Comparing Bowtie Diagram Generation Methods
Ready to explore your digitalization challenges together?
Book a call with Artur Loorpuu, Senior Solutions Engineer in Digitalization. Artur specialises in turning industrial challenges into practical digital solutions through expertise in predictive maintenance, digital twins, data science, and strategic product management.
Let’s explore how we can support your goals!