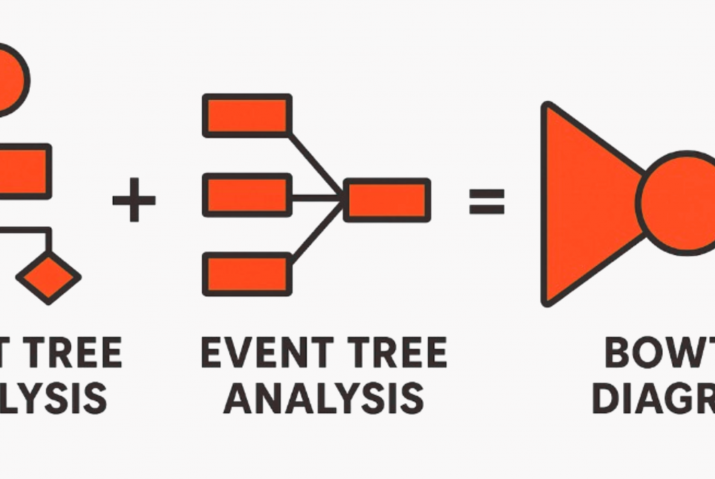
When generating Bowtie diagrams automatically from FMEA data, there’s no “one-size-fits-all” solution. Think of it like navigating to the same destination but choosing different modes of travel: sometimes you fly, sometimes you drive, sometimes you take the train. Each gets you there, but the best option depends on the context.
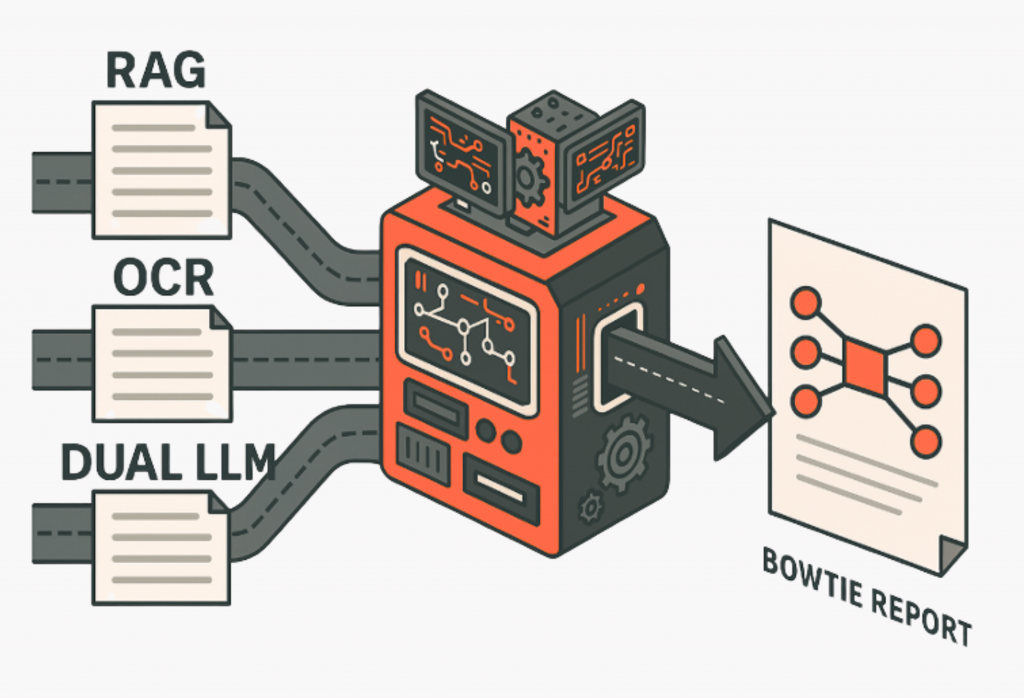
In our research, three distinct pipelines were explored for automating Bowtie generation:
- RAG – Retrieval-Augmented Generation with FMEA tables.
- OCR – Converting scanned tables or PDFs into text.
- Dual LLM – Letting a larger LLM extract table and textual content.
Pipeline Overview: Three Paths to Automated Bowties
Pipeline 1: RAG-Based Extraction – Giving LLMs a knowledge base
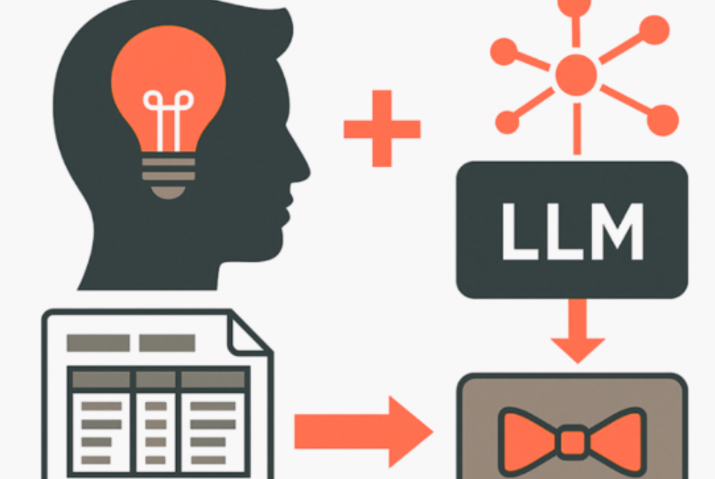
If you’ve been following the rise of LLMs, you’ve probably heard the term RAG: Retrieval-Augmented Generation. At its core, RAG is a way of giving an LLM a smarter memory.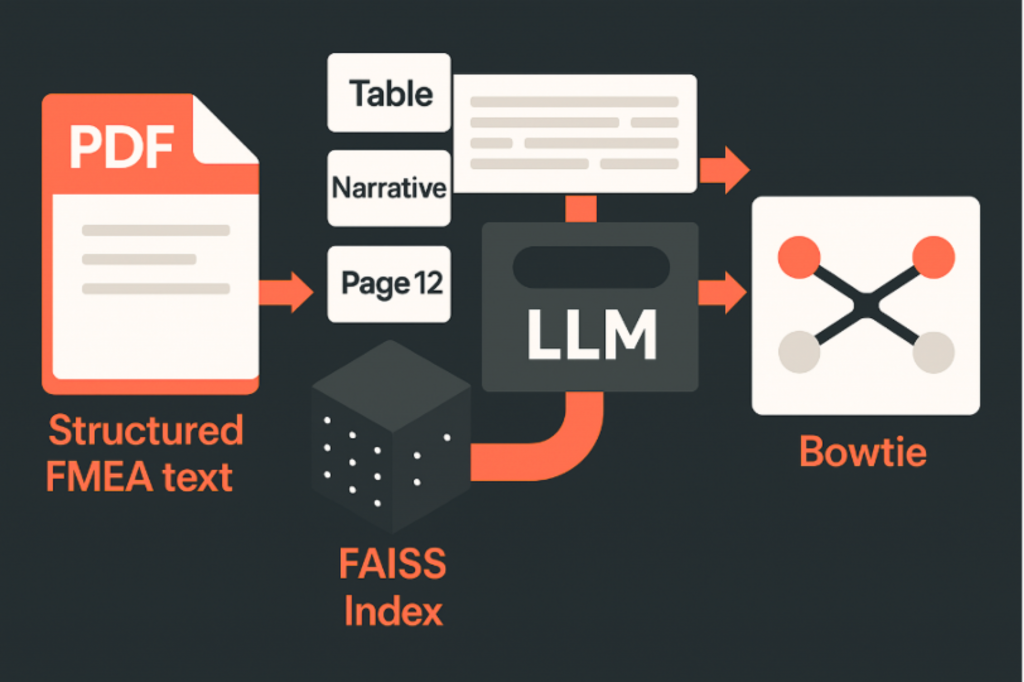
Instead of throwing an entire document at a model and hoping it extracts the right parts, RAG works like a research assistant. First, the document is broken into small, manageable chunks. Each chunk is embedded into a vector space so the computer can measure semantic similarity. Then, when you ask a question, the system doesn’t feed the whole document to the LLM; it just fetches the most relevant passages based on the query. Think of it as the difference between manually searching for a quote in a book versus using a digital index: one is brute force; the other is precise.
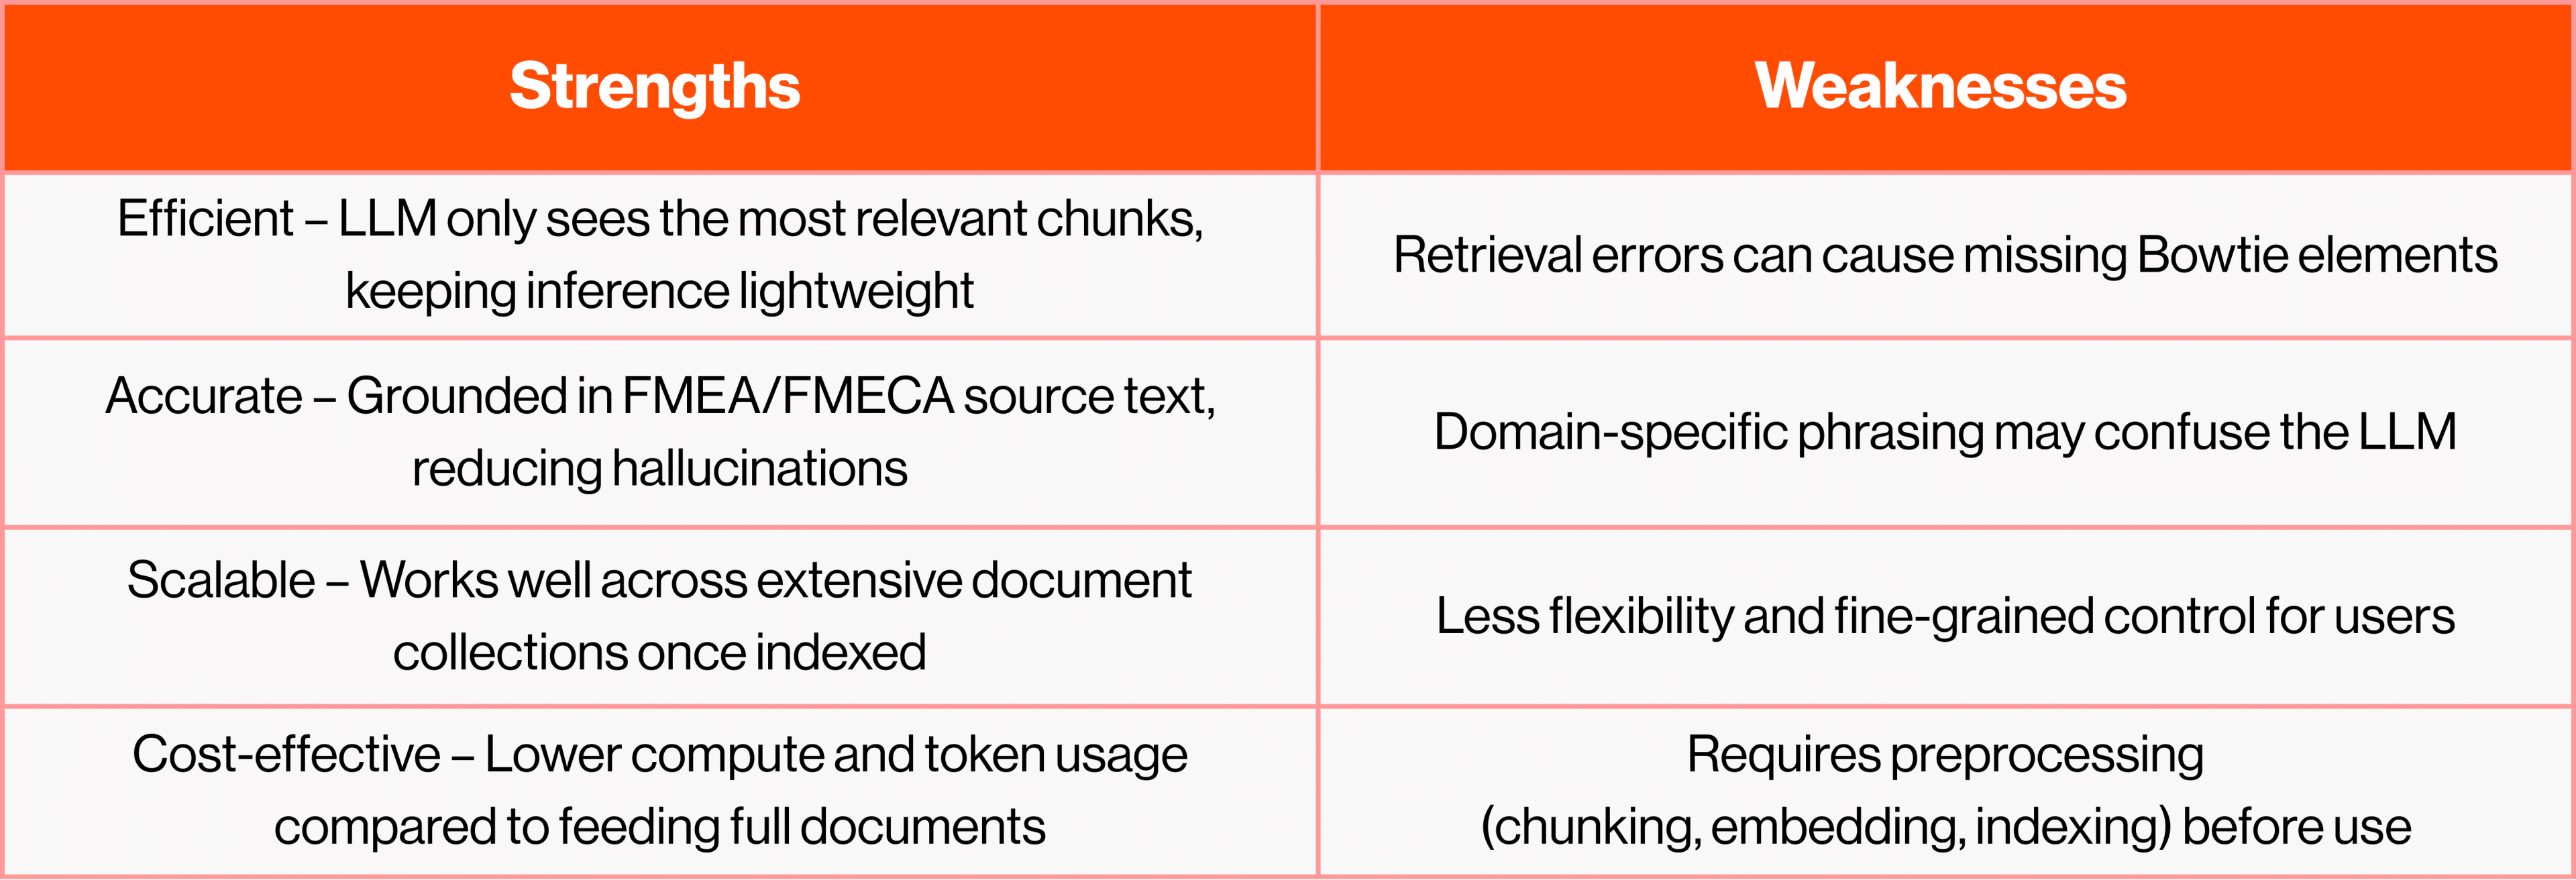
In the context of Bowtie diagram automation from FMEA/FMECA data, RAG acts as the indexing engine that ensures the LLM only sees the most relevant parts. That’s how we keep the process fast, lightweight, and contextually appropriate.
How It Works:
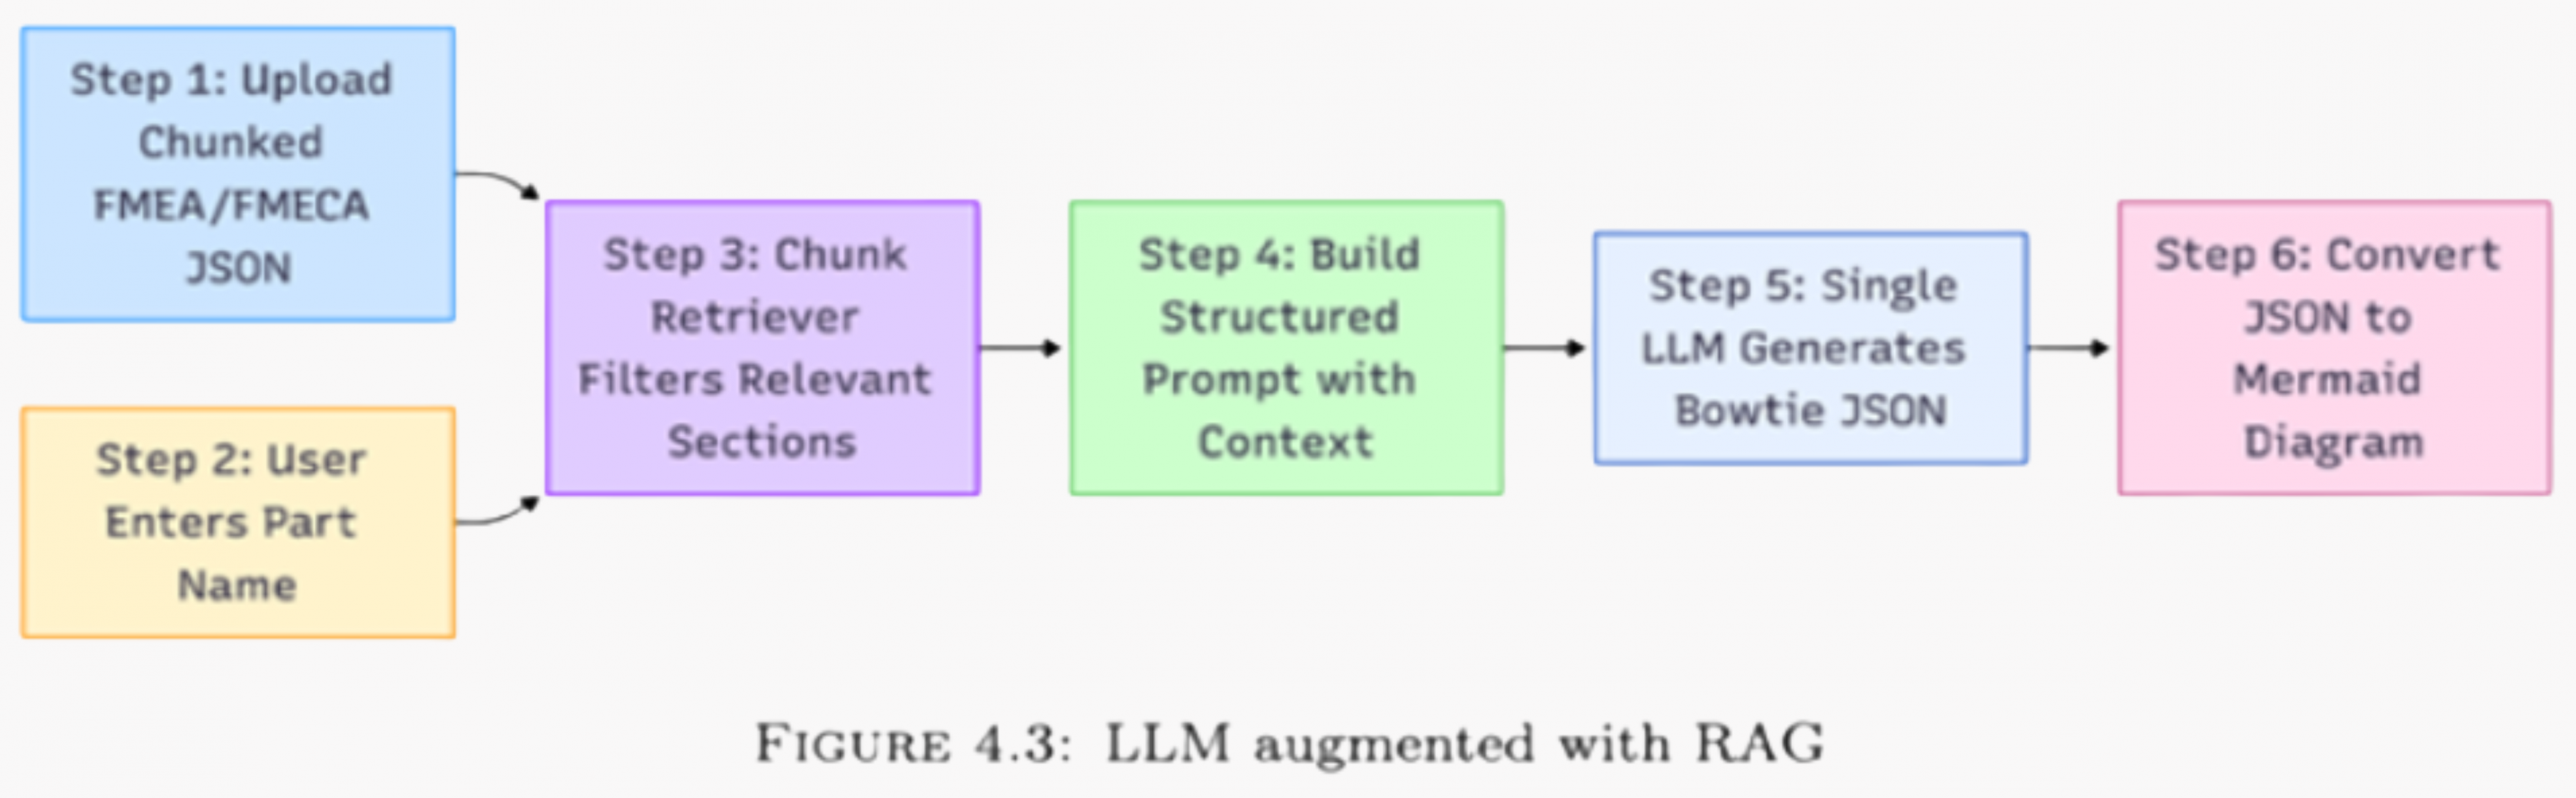
1. Chunking and Preprocessing
FMEA reports usually contain both narrative descriptions and tabular data. Using tools like PyMuPDF and pdfplumber, the content is extracted and divided into small chunks.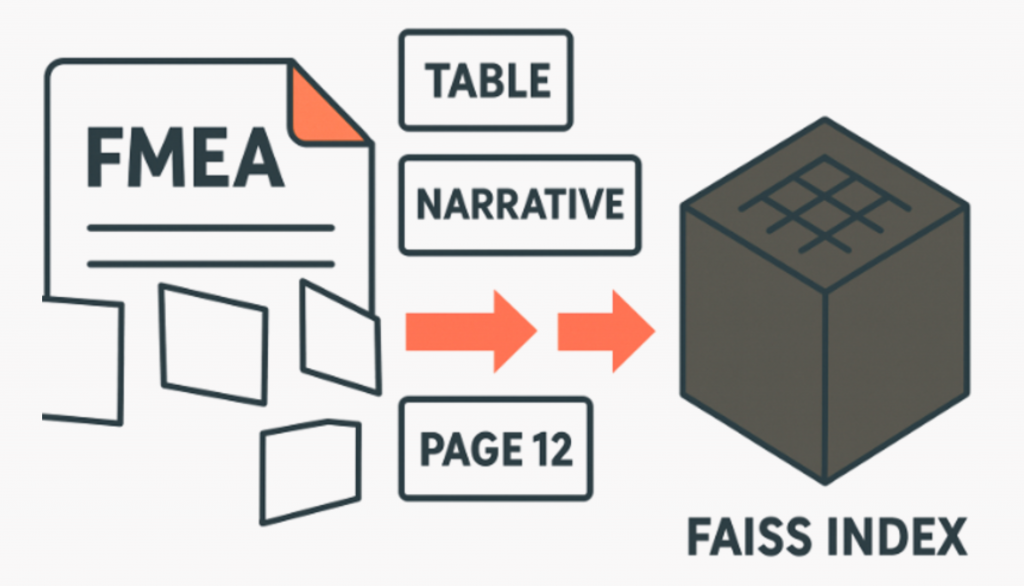
Each chunk is annotated with metadata such as:
- Part name
- Chunk type (table or text)
- Page number
Chunks are embedded into a vector space using the all-MiniLM-L6-v2 model and indexed with FAISS.
What is all-MiniLM-L6-v2?
It’s a lightweight sentence embedding model from the Sentence Transformers library. Instead of treating text as raw words, it converts each chunk into a vector, basically a list of numbers that capture the meaning of the text. This model lets the system compare passages by semantic similarity rather than exact keywords.
What is FAISS?
FAISS (Facebook AI Similarity Search) is an open-source library for quick similarity search. Once all the chunks are embedded as vectors, FAISS makes it possible to find the ones most like a user query quickly. Think of it as Google Search, but instead of keywords, it’s matching on meaning.
2. Semantic Retrieval
When a user requests information about a part (e.g., Valve Assembly), the system retrieves the most semantically relevant chunks for that component.
These can be filtered to prioritise:
- Only tables
- Only narrative text
- Or a blend of both
3. LLM Inference and Visualisation
The retrieved chunks are assembled into a structured prompt, which the LLM processes in one pass. The output is a Bowtie JSON with fields like critical event, causes and consequences. The JSON can then be rendered as a Mermaid diagram for visual inspection.
Pipeline 2: OCR-Based Extraction – Turning Images into Insights
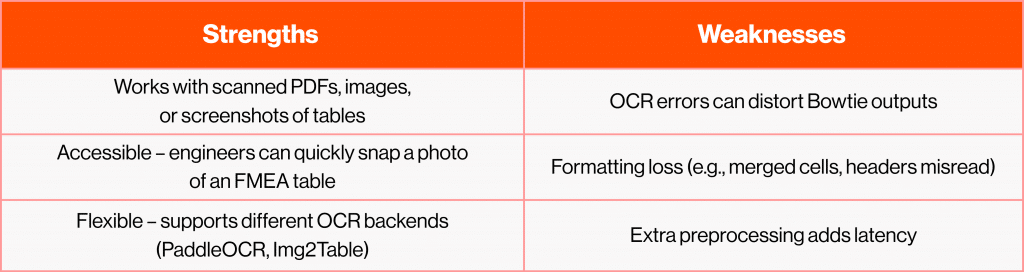
Not all FMEA reports have proper formatting or are cleanly digitised. Engineers often work with scanned PDFs, legacy documents, or quick screenshots of tables. For these situations, RAG alone won’t work because there’s no clean text to retrieve. That’s where OCR (Optical Character Recognition) + LLM comes in. OCR acts as the “translator,” turning pixels into text. From there the text is sent to an LLM creating Bowties.
How It Works:
- Image Preprocessing
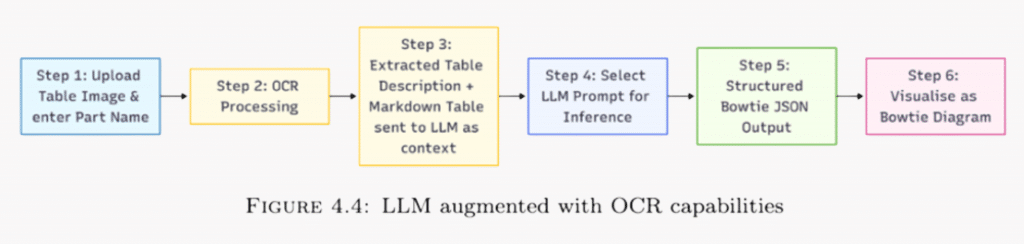
The pipeline begins when the user uploads an image of an FMEA table. The system runs OCR tools such as PaddleOCR or Img2Table to extract structured content. The user also enters the component name in the screenshot.
– Rows and columns are detected.
– Text is reconstructed into Markdown format (or simplified text) of a table.
– The result is a clean, LLM-ready version of the original table. - Feed structured text to the LLM
The processed table is inserted into a tailored Bowtie prompt. The LLM reads this context and generates a structured JSON output containing critical events, causes, barriers, and consequences. - LLM Inference and Visualisation
The JSON output is converted into a visual Bowtie diagram, allowing engineers to analyze and validate the extracted causal structure.
Pipeline 3: Dual LLM – When the Model Can See
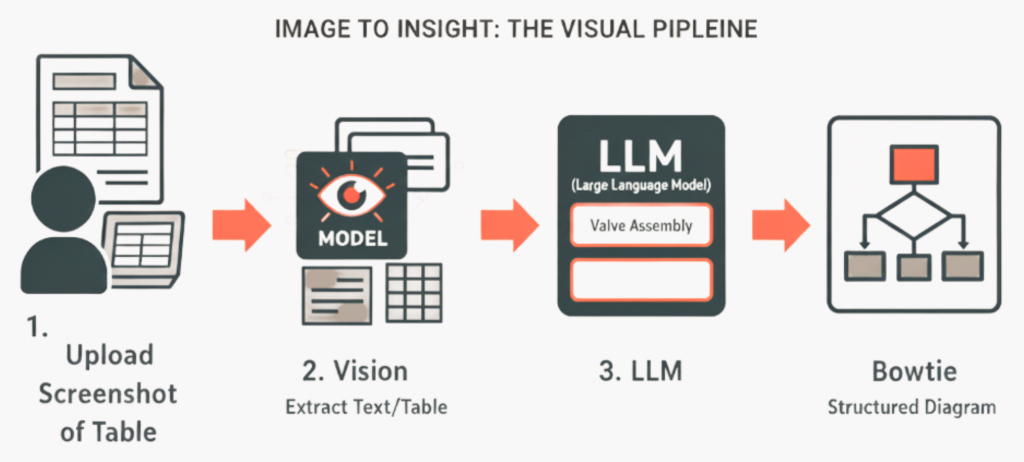
An alternative to the OCR pipeline is to use a Multimodal LLM (Mistral-small). Instead of separating image recognition from text reasoning, these models combine both capabilities: they can “see” an input (like a scanned table, a diagram, or a screenshot of an FMEA report) and directly extract the textual and structural content needed for Bowtie generation.
This makes the approach multimodal, it doesn’t just process text, it integrates information across formats: images, tables, and diagrams. The extracted content can then be passed through the same Bowtie JSON generation process as in other pipelines.
How It Works:
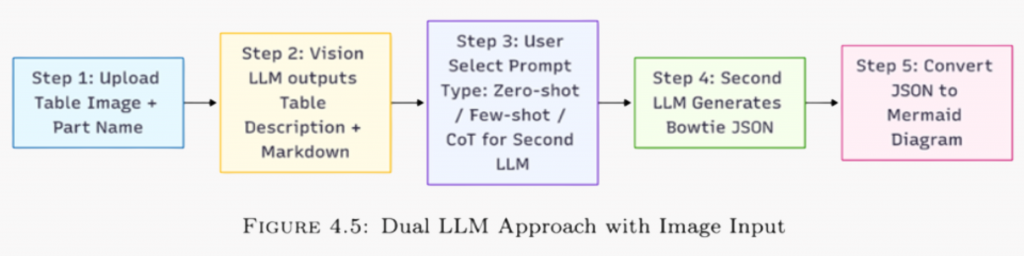
- Upload & Identify
Input a screenshot of an FMEA table (or mixed page) and the part name (e.g., “Valve Assembly”). - Vision LLM → Structured Readout
The Vision LLM converts the image to base 64 and proceeds to extract content:
– A Markdown-formatted table that reconstructs rows/columns and headers.
– A short table description/summary capturing failure modes, causes/mechanisms/effects observed in the image.
This step bypasses traditional OCR by letting the model perform recognition and interpretation jointly (multimodal). - Choose Prompting Style for Generation
User selects prompt type: Zero-shot/Few-shot/Chain-of-Thought (CoT)
What’s passed forward: Part name, Markdown table + summary from Step 2, a structured instruction specifying the target schema (Bowtie JSON). More on the prompting style will follow in Blog 3. - Second LLM → Bowtie JSON
The text LLM receives the structured context and generates Bowtie JSON with the standard set of JSON keys. Then the JSON can be converted to Markdown and render as a Mermaid diagram for review.
So, which pipeline should you choose?
The choice begins with a simple question: what kind of data do you have?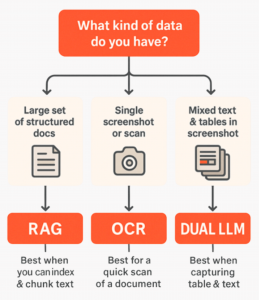
- Large set of structured documents → Use RAG.
Retrieval-Augmented Generation works best when you can index and chunk text. This pipeline excels with digital FMEA/FMECA reports where tables and narratives are easily accessible. - Single screenshot or scanned table → Use OCR.
Optical Character Recognition is the pragmatic choice when there is a table, and you want a quick turnaround for a Bowtie. So, snap a screenshot of it for the LLM to process. - Mixed text and tables in one screenshot → Use Dual LLM.
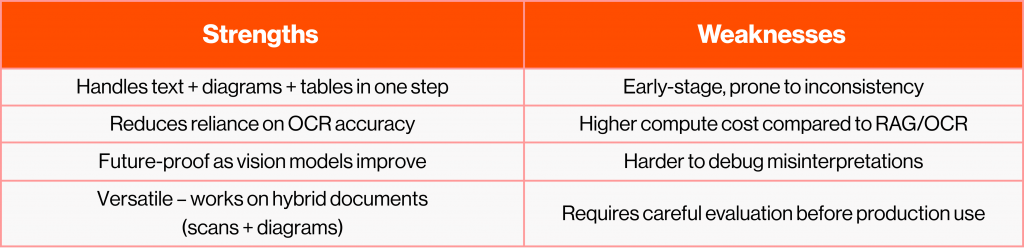
Vision-enabled models can capture both narrative and tabular content in one pass. This pipeline is still maturing, but it is beneficial for hybrid documents that combine text/tabular content with diagrams
Previous article: From FMEA Tables to Bowtie Diagrams: How LLMs Are Changing Failure Analysis
Coming up next: Why Prompt Engineering Still Matters in the Age of Advanced LLMs?
Ready to explore your digitalization challenges together?
Book a call with Artur Loorpuu, Senior Solutions Engineer in Digitalization. Artur specialises in turning industrial challenges into practical digital solutions through expertise in predictive maintenance, digital twins, data science, and strategic product management.
Let’s explore how we can support your goals!