Bowties, not the garment but Bowtie models, evolved from different ways to visualise cause and consequence relationships. It is generally accepted that the earliest mention of Bowtie diagrams (butterfly diagrams) was by David Gill of ICI – Imperial Chemical Industries in the late 70s. The first publication on successfully integrating Bowties into business practices was in the early 1990’s, by Royal Dutch Shell, showing how Bowties can be used to structure risk mitigation.
Bowties are both easy to understand and highly valuable in condition monitoring and predictive maintenance programs supporting you in your decisions to balance risks and costs. When you connect Bowtie models to real-time data you can run data-driven risk assessments on your asset base. And this is possible in APM Studio with Bowtie Rules!
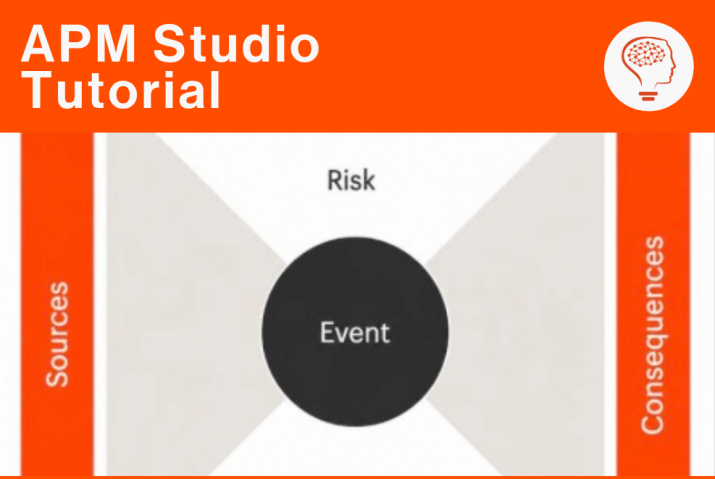
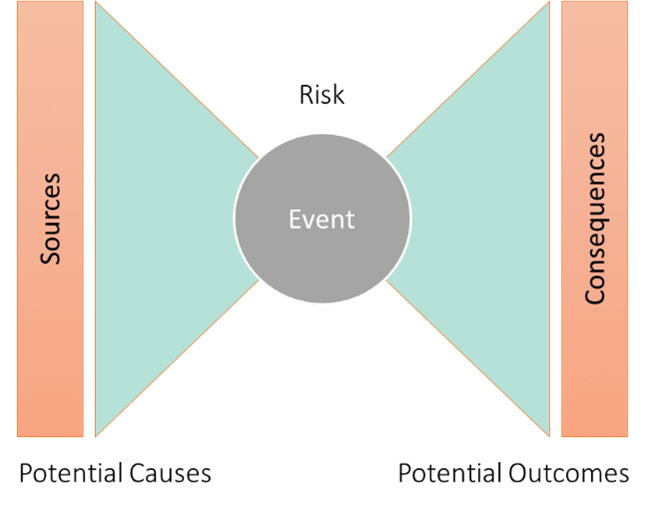
When you look at Bowtie models, they are in essence cause consequence models that document the relationships between pending asset or process failures to causes and expected consequences. Risk at the centre (the knot of the Bowtie), potential causes that can lead to the risk on the left and the consequences (when the event happens) on the right:
This is very closely related to your existing FME(C)A of assets and processes, the example below shows an FMEA of part of a Pump: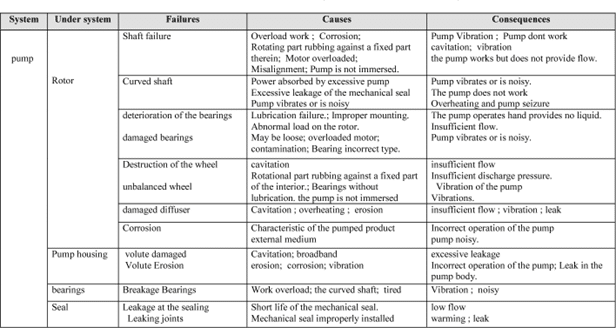
The Failure is the event (the risk) you want to prevent or have early notification on (e.g. Bearing Deformation/Fraction Burn) and causes and consequences are detailed as well in any FMEA. What a Bowtie Rule in APM brings additionally, connected to live data, is likelihood and consequence management.
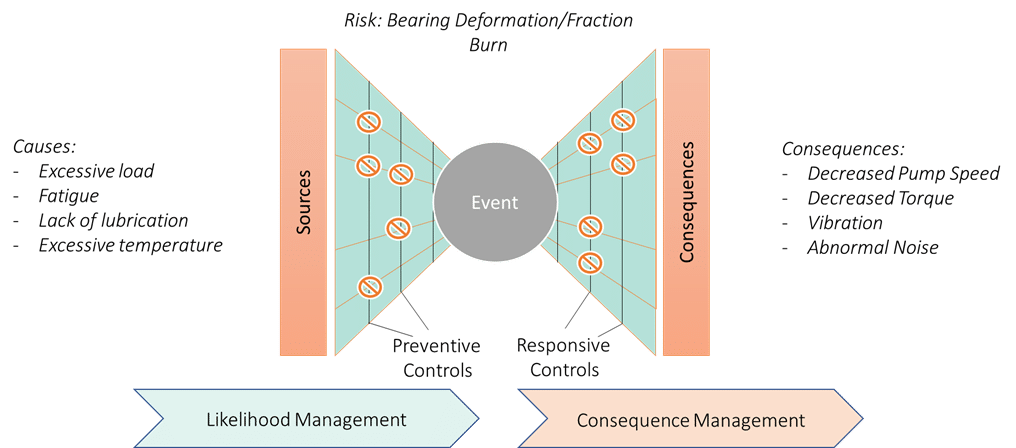
The sources (causes of the event) on the left side of a Bowtie may have 1 or multiple preventive controls that have been put in place to prevent the event from happening. Likewise, the consequences, to the right-hand side of the unwanted event, have a number of responsive controls (barriers) to prevent or delay further consequences.
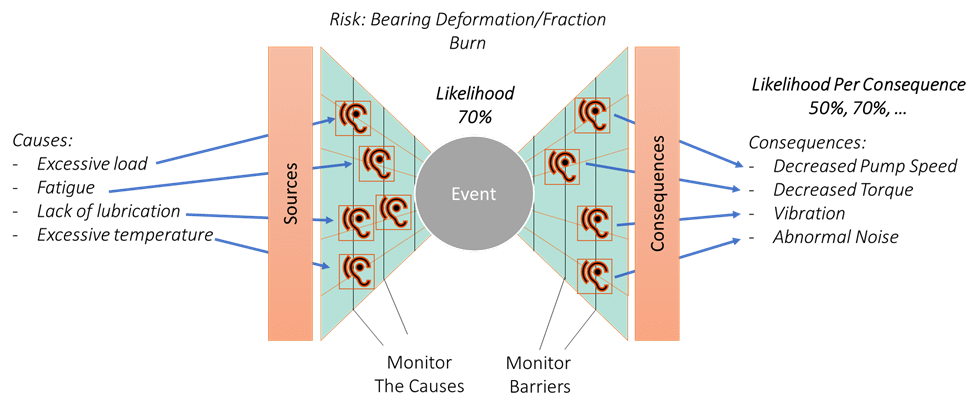
Let’s have a look at a practical example: an event where, for example, a pump bearing deforms/breaks or burns. An unwanted event. The causes of this could be excessive load, fatigue, lack of lubrication or prolonged exposure to excessive temperatures. To prevent this from happening you may keep track of the number of running hours of the pump, the load of the pump and keep an eye on lubrication with ultrasonic sensors etc. All these are preventive ways/measurements that enable you to prevent the unwanted event from happening.
Once you have deformation further excessive load will lead to many different consequences – vibration, decreased pump speed/efficiency and finally pump failure. Here again, you may have responsive controls (procedures that must be followed) to maintain the process the pump is supporting. These responsive controls also act as barriers or delays to further consequences.
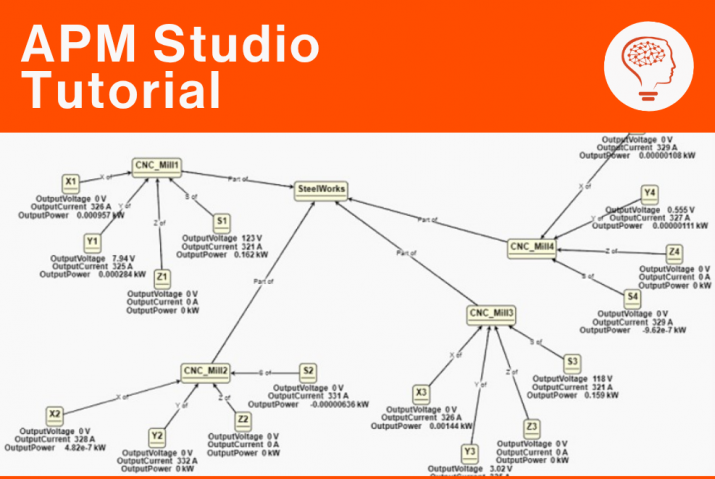
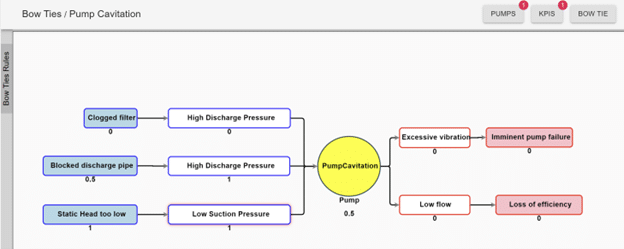
In APM Studio we have the capability to set up Bowties and link these to live data. The below screenshot is a Bowtie setup in APM that follows the previous example:
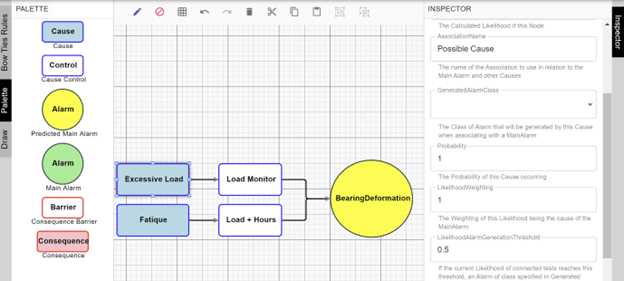
From the Pallete in APM multiple blocks are available that allow you to construct a Bowtie and define the monitoring controls (link it to data and models). Monitoring of Cause Controls, which is done in the white coloured blocks in the centre of the diagram can be achieved in multiple ways. You can link sensor data, history, and trends to determine if a certain Cause Control is currently active and you can run Machine Learning models (Python and PMML) here and Fuzzy models.
When the Bowtie is activated, it will calculate, based upon the Cause Control outcomes the likelihood of a certain Cause being active and the likelihood of the event (the knot of the Bowtie). The Bowtie in APM provides you with a likelihood calculation of an unwanted event where it weighs the different Cause controls in relation to the Cause and the different Causes in relationship to the Unwanted Events.
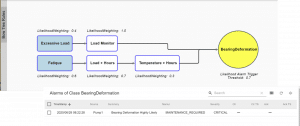
This provides you with the capability to early warn maintenance and operations of upcoming upsets related to multiple causes 24/7. In the example above only the Cause Controls are set up. The same capability is of course available to monitor the consequences (and inform maintenance and operations):
Bowtie Rules in APM can be chained:
- A cause with likelihood > % can be input to other Bowties
- The event detection by a Bowtie can be input for Causes of other Bowties
- Consequence detection can be Cause input for other Bowties
APM Studio enables the creation of true Causal models that can run independently on live data and are easy to understand!
APM Software E-book
Download our e-book to learn what UReason can do for you and discover the unique functionalities of our next-gen APM software.
APM Software E-book
Download our e-book to learn what UReason can do for you and discover the unique functionalities of our next-gen APM software.