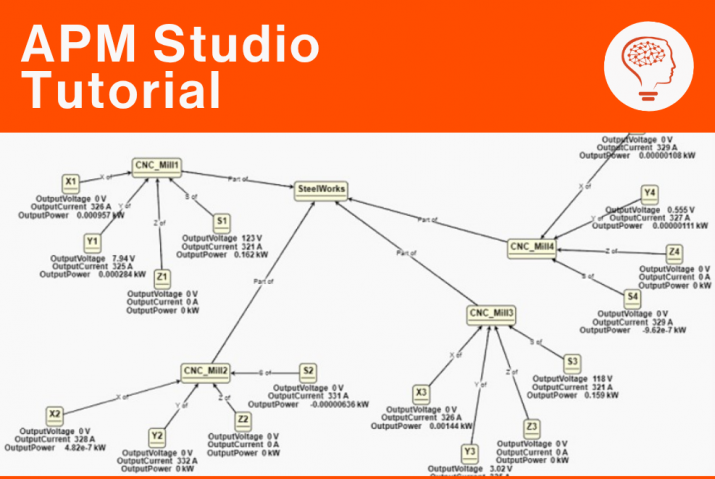
In the previous blog we introduced object models inside APM. These object models provide a conceptual representation of objects, their attributes, behaviours, and the relationships between them within your APM application.
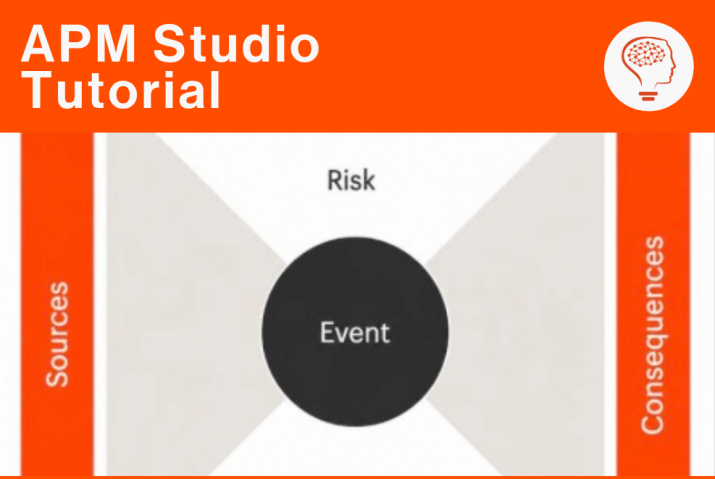
Generally speaking, the behaviour of your assets (objects) can be understood as part of an event-driven system. When an event occurs, they transition from one state into another. Consider a very simple example: a machine in an “off” state, transitions into an “on” state when a power button is pressed. Asset behaviour is much more complicated, but it can still be understood as transitioning between a finite number of possible states. This can be represented visually using State Diagrams or State Machine Diagrams in UML.
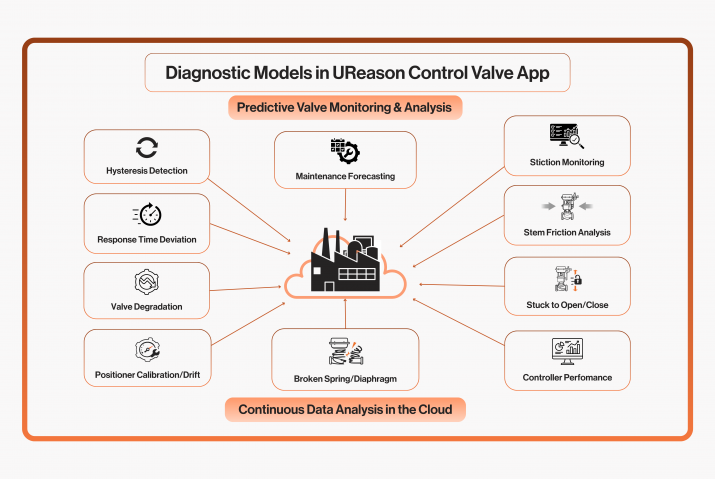
It is important to distinguish the various states in your system because the reaction to certain events will depend on those states. A compressor, for example, may be active and in use, under normal load, or under heavy load. It may not be necessary to check for the existence of the same faults in each of these states. In the same way, the Machine Learning models you may have trained and integrated into your APM application may only run correctly when your asset is in a specific state. As such, you would want to disable the model when the asset is in certain states.
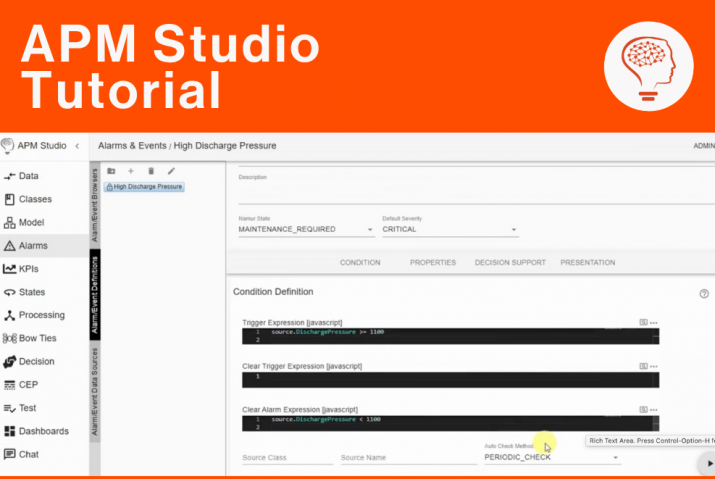
APM Studio allows you to build and execute State Diagrams to represent the behaviour of your assets.
It is important to understand that a state diagram in APM represents the states and the changes in states (transitions), not the processes or commands that caused the transitions.
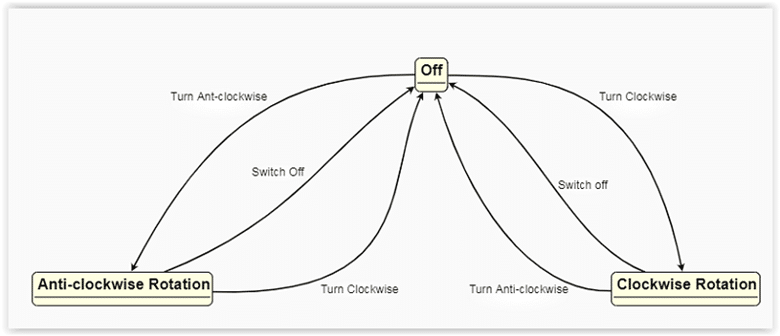
When creating a state diagram for an asset, you must consider the different states that the asset may be in and the transitions between these states. Certain transitions will not apply when an asset is in a particular state. For instance, a motor that is in a “clockwise rotation” state must transition to an “off” state before transitioning to an “anticlockwise rotation” state:
The elements of an APM State Diagrams can be cloned from the palette and configured:
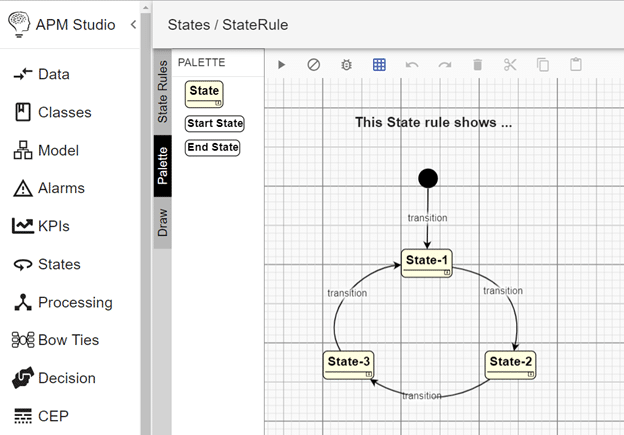
A State Diagram consists of the following elements:
- Start State – This is the starting point of your State Diagram.
- State – Represents a behavioural/process state of an asset that your application needs to know about.
- Transitions – These are the pathways from one state to the next.
- End State – This is the ending point of the State Diagram.
Generally, you create state diagrams for a type of asset or process as many instances of the assets/processes require the same state processing. Creating identical state diagrams for each asset would be tedious and difficult to maintain since any modifications to the state logic would require modifications to all the diagrams. State diagrams like other types of diagrams in APM can be built in a generic fashion to apply to classes of objects instead of specific ones.
APM Software E-book
Download our e-book to learn what UReason can do for you and discover the unique functionalities of our next-gen APM software.
APM Software E-book
Download our e-book to learn what UReason can do for you and discover the unique functionalities of our next-gen APM software.