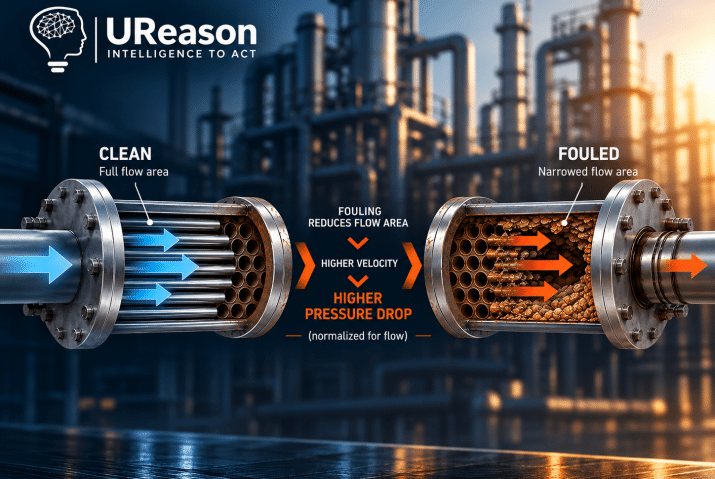
Every monitoring signal we’ve discussed — UA, effectiveness, normalized pressure drop — shares a quiet dependency that’s easy to overlook. A trend line only means something if you know where it started. A UA of a certain value isn’t “good” or “bad” in isolation; it’s only meaningful relative to what that exchanger reads when it’s clean. Without that reference point, you have numbers moving around with no way to say whether they’re moving away from health or just moving. The clean-condition baseline is what turns raw measurement into judgment.
Think of it as the “you are here” marker. Fouling is diagnosed by departure — a decline in heat transfer capacity, a rise in normalized pressure drop, relative to how the unit behaves with nothing on its surfaces. The baseline is that reference. It answers the essential question no single reading can: is this the exchanger’s normal, or is it drifting? Get the baseline right and every subsequent measurement gains meaning. Get it wrong, and you’ll either chase phantom problems on a healthy unit or stay comfortably blind while a real one fouls.
So where does a good baseline come from? The cleanest source is exactly that — data captured just after commissioning or right after a thorough cleaning, when you know for certain the surfaces are bare. A stretch of that data, spanning a range of normal operating conditions, gives you the exchanger’s clean fingerprint: what UA and normalized pressure drop should be across the loads and temperatures it actually sees. Design-sheet values can serve as a rough starting point, but they describe an idealized unit under design conditions, not your specific exchanger in your specific service — so measured clean data almost always beats the datasheet.
Two subtleties separate a baseline you can trust from one that quietly misleads.
The first is that a baseline is rarely a single number — it’s a reference across conditions. A clean exchanger’s UA and pressure drop still shift with flow, load, and inlet temperatures, for entirely healthy reasons. A good baseline captures that expected behavior, so you’re comparing today’s reading against what clean would look like at today’s operating point, not against a fixed value that only applied on the day you happened to record it. This is why normalization matters so much: it’s what lets a baseline hold up when conditions move.
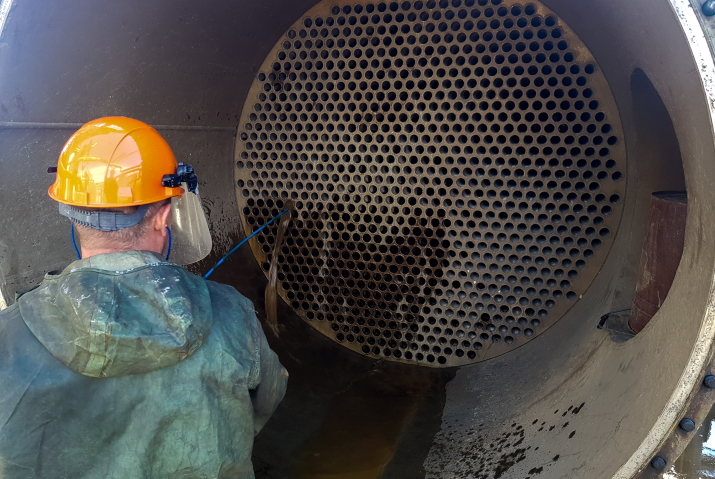
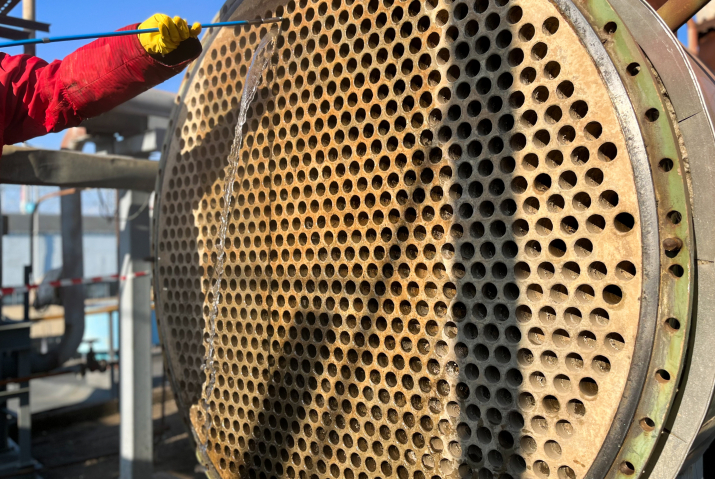
The second is that baselines don’t always stay valid forever. A physical change to the unit — retubing, a bundle replacement, a service or duty change — resets the exchanger’s clean condition, and the old baseline no longer describes the equipment in front of you. The discipline is to re-establish the baseline after any such event. Ideally, each cleaning offers a fresh checkpoint: if a thorough clean doesn’t return the unit close to its baseline, that itself is telling you something — either the baseline has drifted or the cleaning didn’t fully restore the surfaces.
The payoff for this bit of rigor is everything downstream. A trustworthy baseline is what lets you quantify how much performance you’ve lost, set sensible thresholds for when to act, and calculate what fouling is costing right now rather than guessing. It’s the difference between “the number looks a bit low” and “this unit is 15% below its clean UA and declining a point a month.” One is a shrug; the other is a decision.
And, fittingly, the baseline draws on the same source as everything built on top of it: the temperatures, flows, and pressures already in your historian. Capturing “good” doesn’t take new instruments — just the discipline to mark where health begins, so every later reading has something honest to measure against.
See Heat Exchanger Health More Clearly
Book a call with Artur Loorpuu, Senior Solutions Engineer at UReason, to explore how your existing process data can help detect heat exchanger fouling early, track performance, and support smarter maintenance decisions.