From Connectivity to Risk
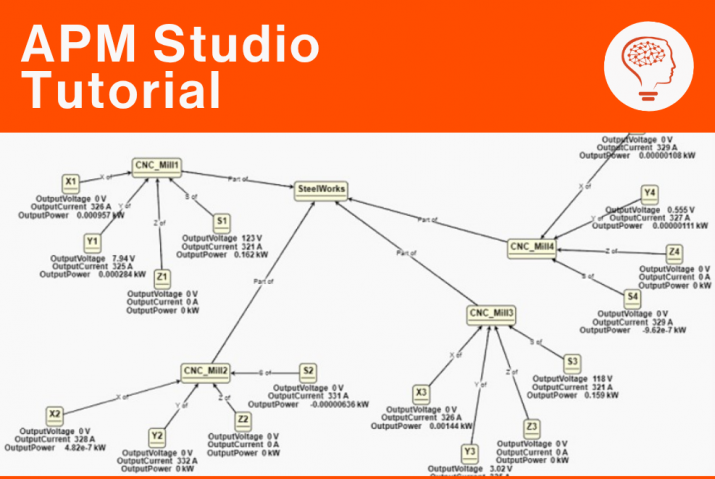
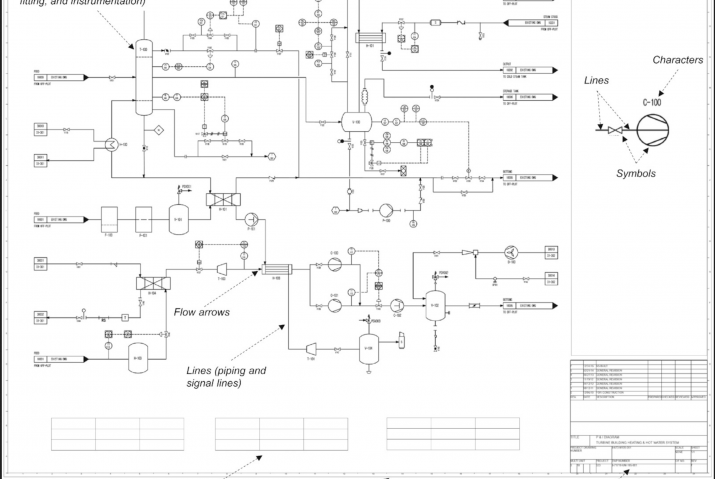
The first post in this series looked at how Process Insights turns a static P&ID into a queryable knowledge graph. Select a component, click Trace Connections, and the platform maps every affected component that sits upstream and downstream from that node. That’s the plant’s physical connectivity made easily accessible to plant personnel.
But connectivity is only half the picture. The other half is managing risk.
- Which failure modes matter on those connected assets?
- What the consequences look like if a barrier fails?
Most plants already have that information somewhere in an FMEA spreadsheet. The issue is that an FMEA (or FMECA) is difficult to reason about once systems become large and interconnected.
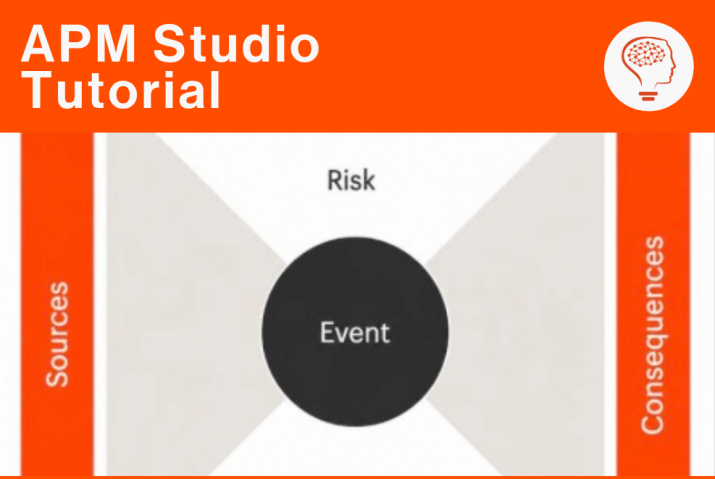
That’s where the bowtie comes in.
The FMEA Table Is A Starting Point
Every plant has an FMEA table somewhere, usually in a spreadsheet. Rows of failure modes, causes, consequences and safeguards. The important work has already been done.
The problem is that tables are good at storing information, but poor at showing relationships. A bowtie changes that immediately. Instead of scanning row by row, engineers can see how causes connect to a central event, how consequences branch outward, and where barriers sit across each pathway. Weaknesses become easier to spot because the structure is visible instead of implied. The value of bowties has never really been the issue. The issue is the amount of engineering time required to build and maintain them properly.
Why Most Bowties Never Get Beyond Workshops
For a single asset, building a bowtie manually is manageable. An engineer works through the FMEA, extracts the relevant failure paths, maps the barriers, and builds the diagram. It takes time, but it is achievable.
Scale is where things break down.
A real plant may have hundreds of assets, each with multiple failure modes and years of accumulated documentation behind them. Manuals, datasheets, incident reports, operating procedures, inspection histories, all containing fragments of information relevant to the same risk picture. Even assets that look nearly identicaloften differ enough in safeguards or operating conditions that diagrams cannot simply be reused.
So, most organisations prioritise the highest-risk or highest-visibility systems and they get detailed bowties. Everything else remains buried in spreadsheets because there simply is not enough engineering bandwidth to keep up. Even when bowties do exist, maintaining them becomes another challenge entirely.
The FMEA changes, a safeguard is added or a consequence gets reclassified. An operating philosophy changes after an incident review. Unless someone manually updates the diagram as well, the bowtie slowly drifts away from the source material. At that point, the bowtie becomes presentation material rather than a living engineering artefact.
Upload the FMEA, Get the Bowtie
Process Insights is designed to remove most of that manual reconstruction work. In the FMEA tab, engineers can upload either an Excel sheet or a screenshot of an existing FMEA table. The platform extracts the failure modes, causes, consequences, and safeguards into a structured, editable view before any diagram generation happens.
The extraction step is intentionally reviewable. Engineers can correct terminology, adjust mappings, add missing safeguards, or update severity, occurrence, and detectability fields before moving forward. The objective is not to automate judgement out of the process. It is to reduce the repetitive work required to get to the first usable draft.


Once the data looks correct, the Bowtie tab offers two generation modes. The first mode produces a direct representation of the uploaded FMEA. Nothing new is introduced. The resulting diagram reflects exactly what exists in the table. The second mode uses an LLM to assist the process.
Instead of only reproducing the existing data, Process Insights suggests additional controls or safeguards that may be missing from the original FMEA. Engineers can review every suggestion, before accepting they can be modified or discarded. That distinction is important. The system is not making risk decisions automatically. It is helping engineers identify potential gaps faster than they would manually.


Either way, the generated bowtie is a starting point, not a finished product. Engineers can jump straight into editing on the canvas adding causes, removing controls, renaming nodes, adjusting connections. The diagram evolves with the team’s understanding of the asset.
Filling the Gaps
A generated bowtie, whether faithful or LLM-assisted, will sometimes have gaps. A cause with no controls. A consequence with no barriers. Process Insights surfaces these proactively through the Sparse panel.
Clicking the Sparse button opens a panel that lists every node flagged as unprotected, grouped by type: causes with no controls, consequences with no barriers. For each one, a Suggest button asks the LLM to propose appropriate controls or barriers based on the failure mode and process context. A count adjuster lets engineers control how many suggestions come back. Engineers review each suggestion and decide what to accept.

For engineers who prefer to work directly on the diagram, cmd-clicking any node on the canvas opens a contextual toolbar with a “Suggest controls & barriers” option for that specific element. Same capability, different entry point.

Tracking Changes Over Time
One of the problems with traditional bowties is that they are difficult to evolve over time. Process Insights handles this through version history.
Every saved state of the bowtie is stored in History. The History panel shows a versioned log of changes and a summary of what was changed. Each entry is tagged with how it was generated, whether that was an initial faithful generation from the FMEA, an LLM-assisted build, or a manual edit by a user.

Select any two versions and click Compare. The bowtie diagram updates to show a colour-coded diff: added nodes in green, removed nodes in red, modified nodes highlighted separately. A summary banner at the top shows the counts at a glance. Engineers can see exactly what changed between the version that came out of the FMEA and the version that exists after a workshop, an incident review, or a round of AI suggestions.

If a change introduced something that shouldn’t have been there, any previous version can be restored with a single click.
From Diagram to Monitoring
A bowtie built in Process Insights can also be exported as a JSON file, carrying the full set of relationships between causes, top events, consequences, and barriers.
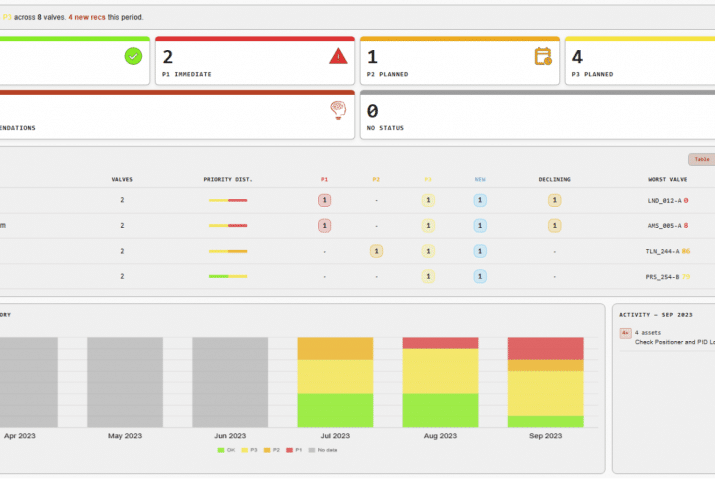
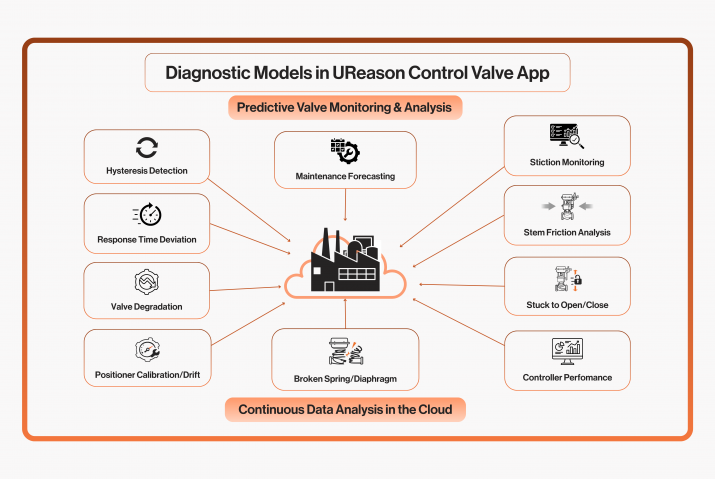
That JSON feeds directly into APM, UReason’s asset performance management platform, where it becomes the foundation of a monitoring solution. Barriers become conditions to track. Failure modes become signals to watch. The analysis done once in a spreadsheet runs continuously against live plant data. Read that story here
Good Input Still Matters
Like most engineering workflows, the quality of the output still depends heavily on the quality of the input. A clean FMEA with consistent terminology and structured columns will generate far better results than spreadsheets filled with merged cells, inconsistent naming, or partially completed rows.
The platform can handle imperfect data, but cleaner input means less manual correction later. If you are unsure whether an existing FMEA is suitable, bring it to a demo session and we can walk through it together.
Next in the series
At some point during any bowtie review, someone asks a question the diagram itself cannot answer.
What does the SOP say about this isolation step?
What operating limits apply to that vessel?
Has this safeguard failed before?
The answers usually exist somewhere in the documentation. buried in manuals, procedures, or reports that engineers do not have time to search through manually.
In the next post, we’ll look at how Process Insights allows users to have a conversation with their own documentation, with answers linked directly back to the original source material. No more hunting through manuals.
Find Process Impact in Seconds
Book a call with us to explore how Process Insights transforms static P&IDs into interactive engineering systems for troubleshooting and FMEA workflows.