The Bowtie method is a barrier risk model that enables the identification and management of risk. This method is widely used by companies in aviation, chemical, and petrochemical industries.
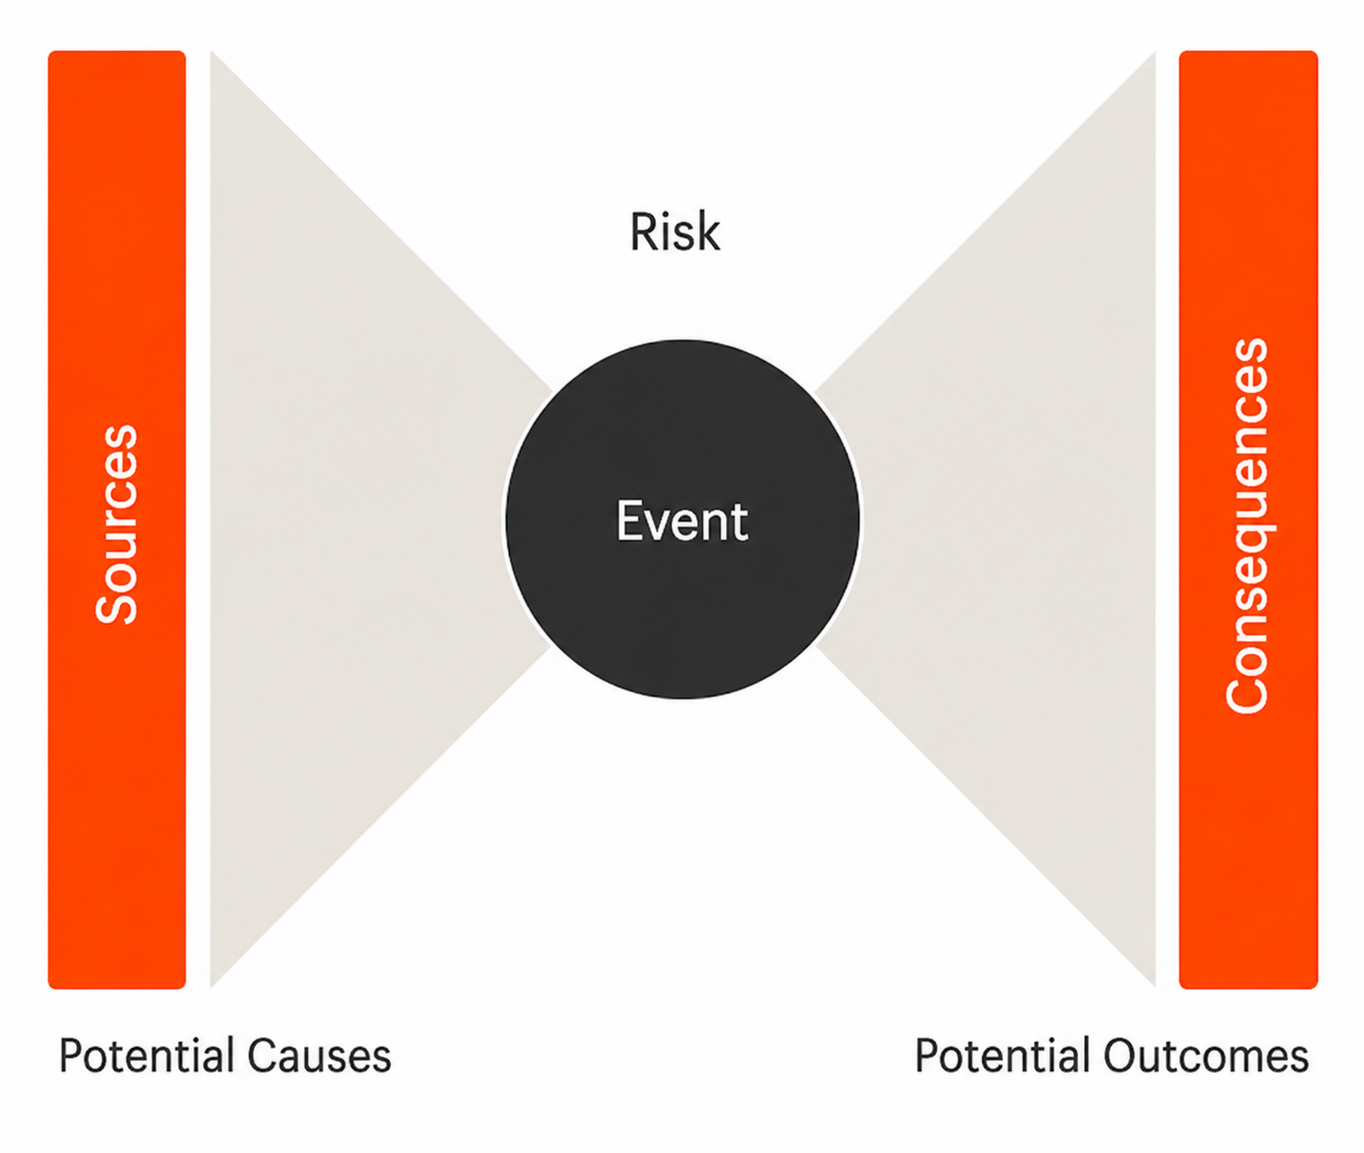
They are in essence to cause consequence models that document the relationships between pending asset or process failures to causes and expected consequences. Risk at the center (the knot of the Bowtie), potential causes that can lead to the risk on the left and the consequences (when the event happens) on the right:
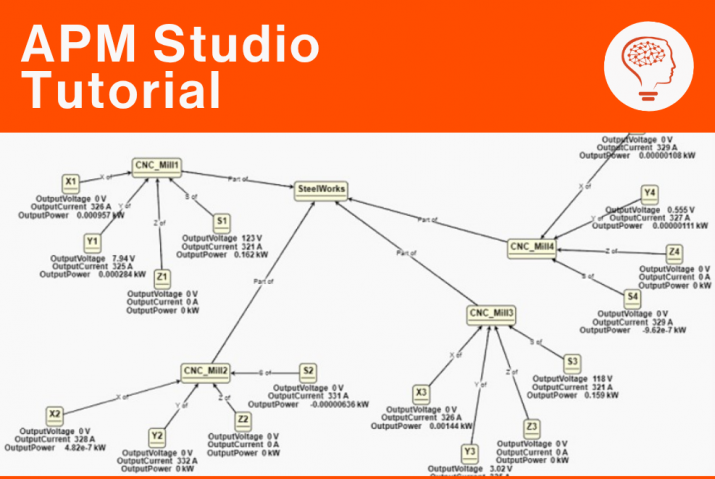
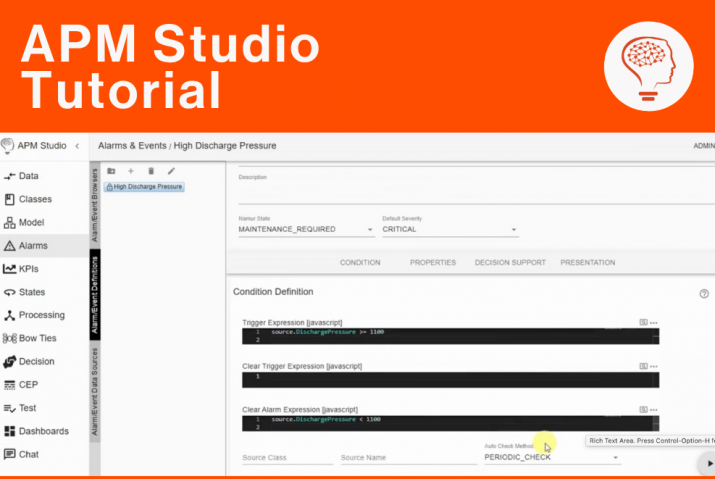
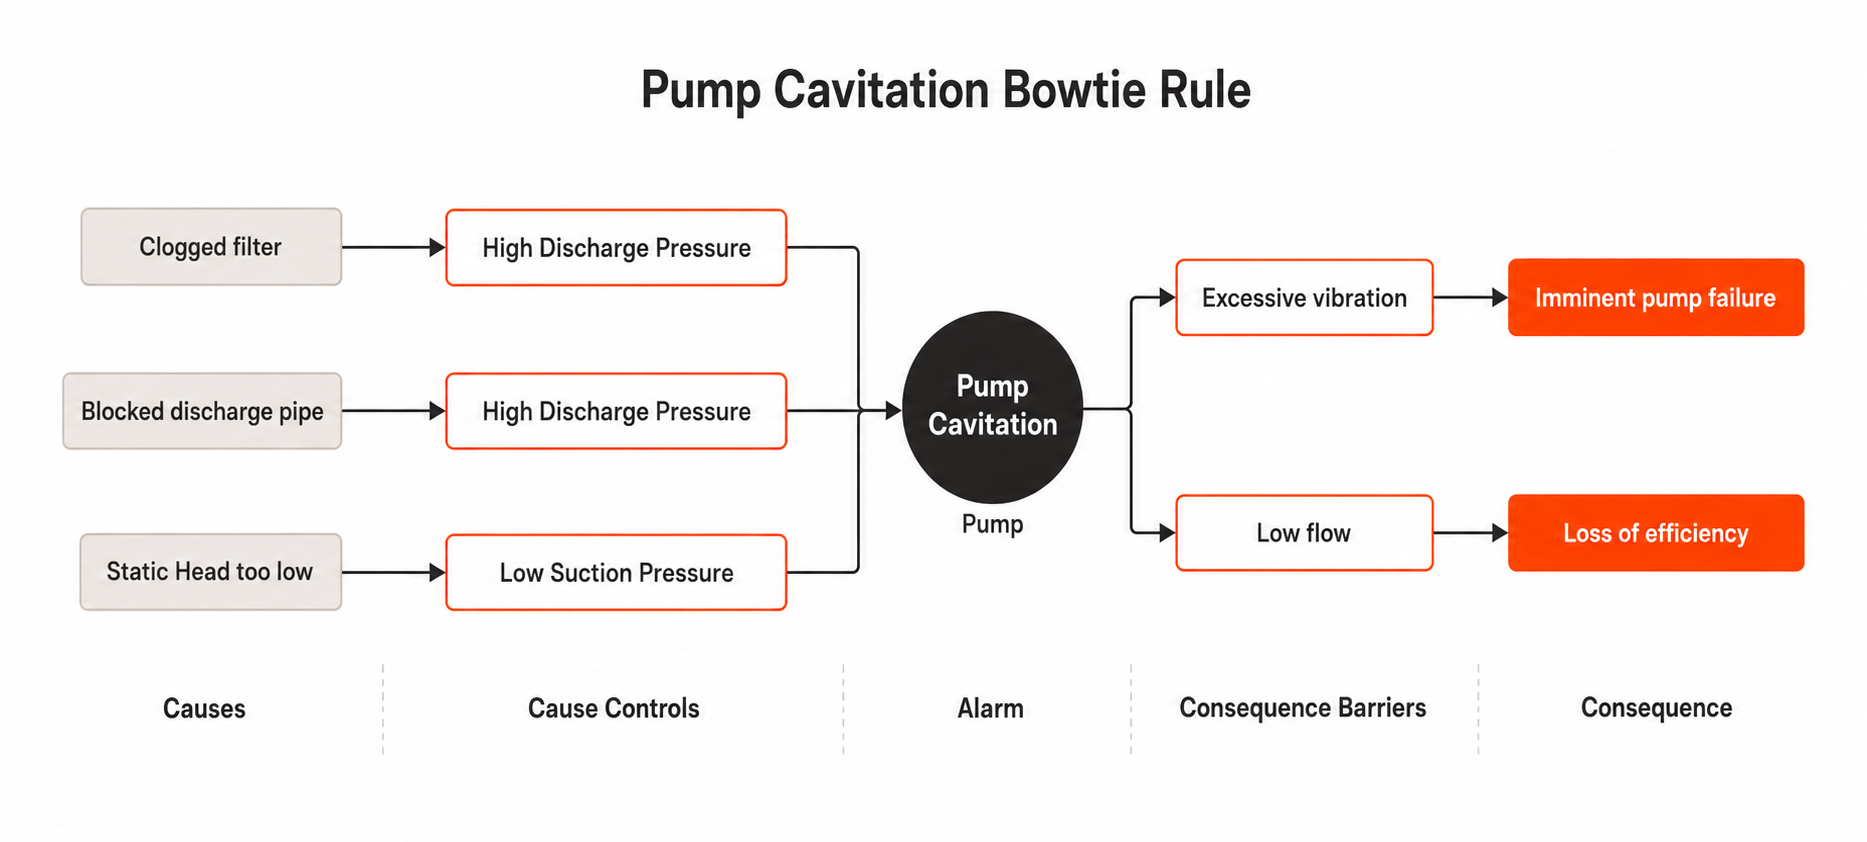
This tutorial illustrates how Bowtie rules relate symptoms to causes and generate alarms based on those causes. The bowtie model detects pump cavitation and indicates the possible consequences.

Benefits of Using Bowtie Models in APM Studio
A bowtie model is a structured, visual approach to risk assessment that maps out how a particular hazard can escalate into a critical event, and what controls are in place to either prevent that escalation or limit the damage if it occurs. It is equally useful as a communication tool, making complex risk scenarios accessible to a wide audience across an organization.
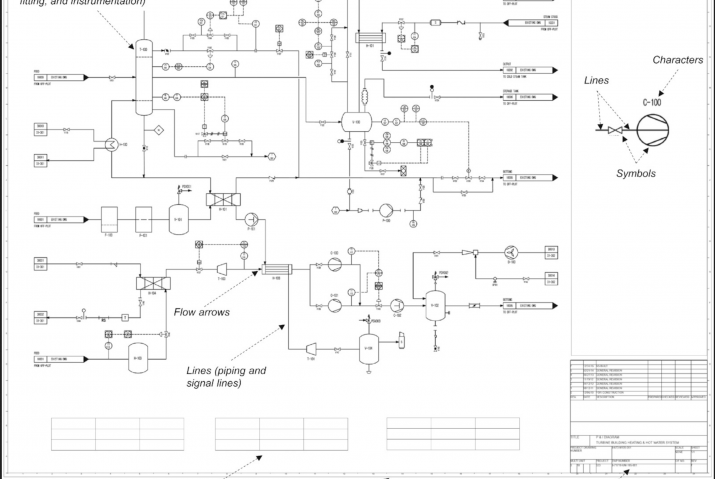
In an industrial process environment, bowtie models serve as a practical tool for managing process safety at both a strategic and operational level.
At the process level, the bowtie provides a clear line of sight from individual plant hazards through to their potential consequences, helping engineers and safety teams identify where critical safeguards are in place, where gaps exist, and where controls may be over-relied upon. This is particularly valuable during hazard identification studies, management of change reviews, and the development or revision of safe operating limits.
At the operational level, bowtie models help frontline personnel understand the specific barriers they are responsible for maintaining and why those barriers matter. In process industries where a single control failure can initiate a chain of events leading to a major incident, this clarity of ownership is essential. It supports permit-to-work systems, shift handover protocols, and the day-to-day discipline required to keep safety-critical equipment in a known and functional state.
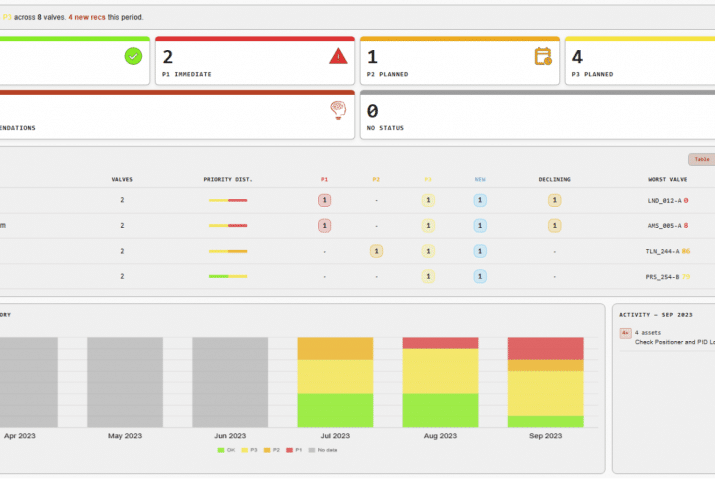
Bowties are both easy to understand and highly valuable in condition monitoring and predictive maintenance programs supporting decisions to balance risks and costs. When a Bowtie model is connected to real-time data, one can run data-driven risk assessments on the asset base.
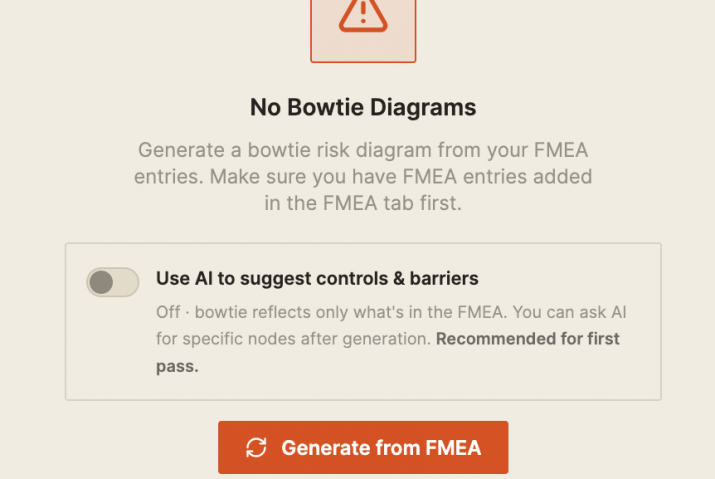
Bowties in APM Studio have a well-defined structure and are easy to explain because they are graphical as shown in the demonstration above.
Structure and Key Components
The diagram is organised around five core elements:
- Hazard — the source of potential harm inherent to the process, such as stored energy, hazardous substances, or high-pressure systems
- Top Event — the critical moment at which control of the hazard breaks down, such as a loss of containment or process upset
- Threats — the conditions or failures that could drive the situation toward the top event, shown on the left side of the diagram. These may include equipment failure, operator error, or degraded process conditions
- Consequences — the range of outcomes that may follow if the top event is not contained, shown on the right side. In an industrial context these typically include fire, explosion, toxic release, environmental damage, or plant shutdown
- Barriers — the controls deployed on both sides to either prevent the top event from occurring or reduce its impact if it does
Want expert guidance for your APM Studio configuration?
Book a call with Artur Loorpuu, Senior Solutions Engineer in Digitalization. Artur specialises in turning industrial challenges into practical digital solutions through expertise in predictive maintenance, digital twins, data science, and strategic product management.
Let’s explore how we can support your goals!